Original Link: https://www.anandtech.com/show/4186/ocz-vertex-3-preview-the-first-client-focused-sf2200
OCZ Vertex 3 Preview: Faster and Cheaper than the Vertex 3 Pro
by Anand Lal Shimpi on February 24, 2011 9:02 AM ESTLast week OCZ pulled the trigger and introduced the world’s first SF-2000 based SSD: the Vertex 3 Pro. Not only was it the world’s first drive to use SandForce’s 2nd generation SSD controller, the Vertex 3 Pro was also the first SATA drive we’ve tested to be able to break 500MB/s on both reads and writes. Granted that’s with highly compressible data but the figures are impressive nonetheless. What wasn’t impressive however was the price. The Vertex 3 Pro is an enterprise class drive, complete with features that aren’t exactly in high demand on a desktop. As a result the V3P commands a premium - the drive starts at $525 for a 100GB capacity.
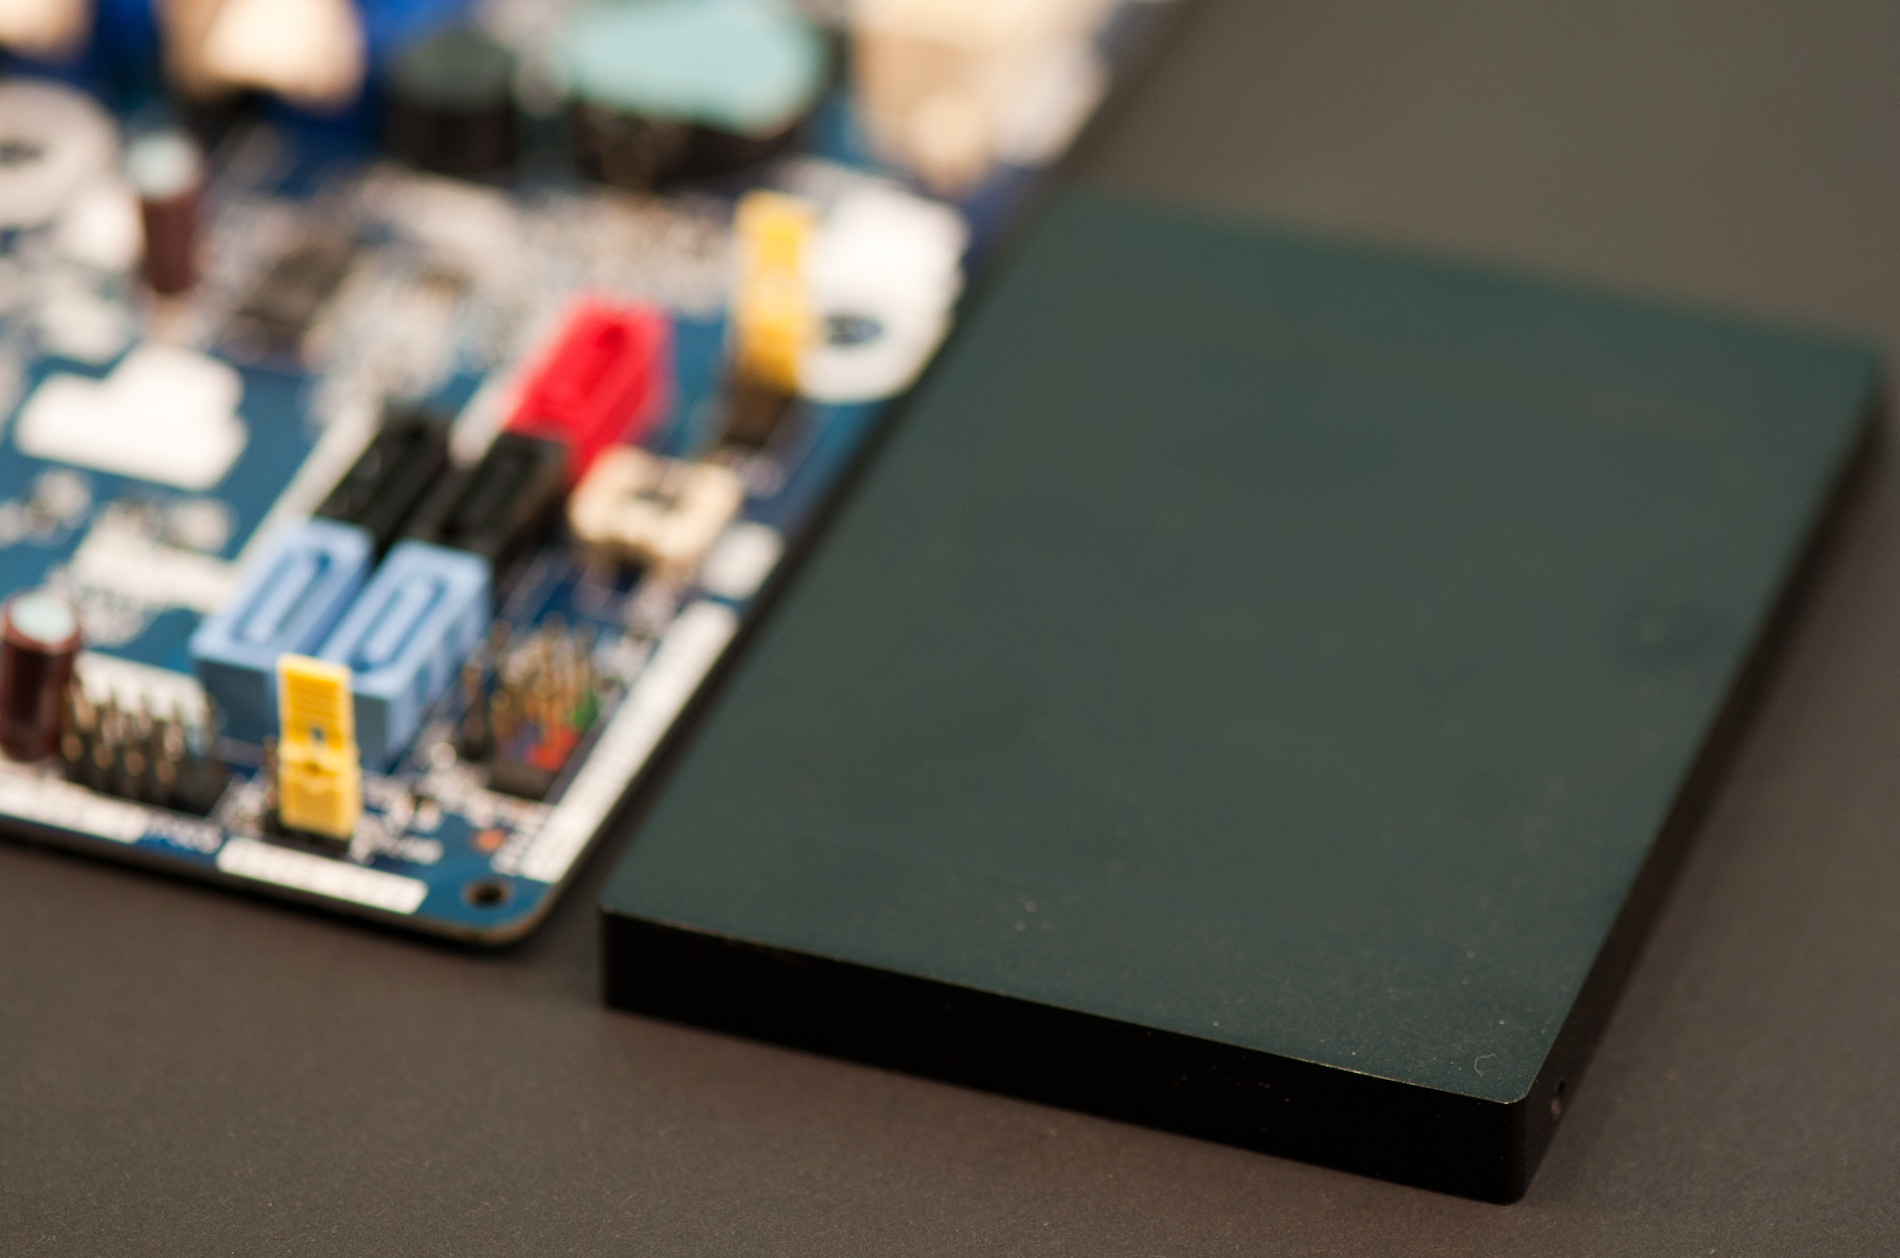
Just as we saw last round however, if there’s a Vertex 3 Pro, there’s bound to be a more reasonably priced non-Pro version without some of the enterprisey features. Indeed there is. Contained within this nondescript housing is the first beta of OCZ’s Vertex 3 based on a SandForce SF-2200 series controller. The price point? Less than half of that of the V3P:
| Pricing Comparison | |||||
| 128GB | 256GB | 512GB | |||
| OCZ Vertex 3 Pro | $525 (100GB) | $775 (200GB) | $1350 (400GB) | ||
| OCZ Vertex 3 | $249.99 | $499.99 | N/A | ||
At an estimated $250 for a 120GB drive the Vertex 3 is more expensive than today’s Vertex 2, but not by too much nor do I expect that price premium to last for long. The Vertex 2 is on its way out and will ultimately be replaced by the V3. And SSD prices will continue to fall.
What sets a Vertex 3 apart from a Vertex 3 Pro? Not all that much, but SandForce has grown a lot in the past year and instead of just a couple of SKUs this time around there are no less than seven members of the SF-2000 family.
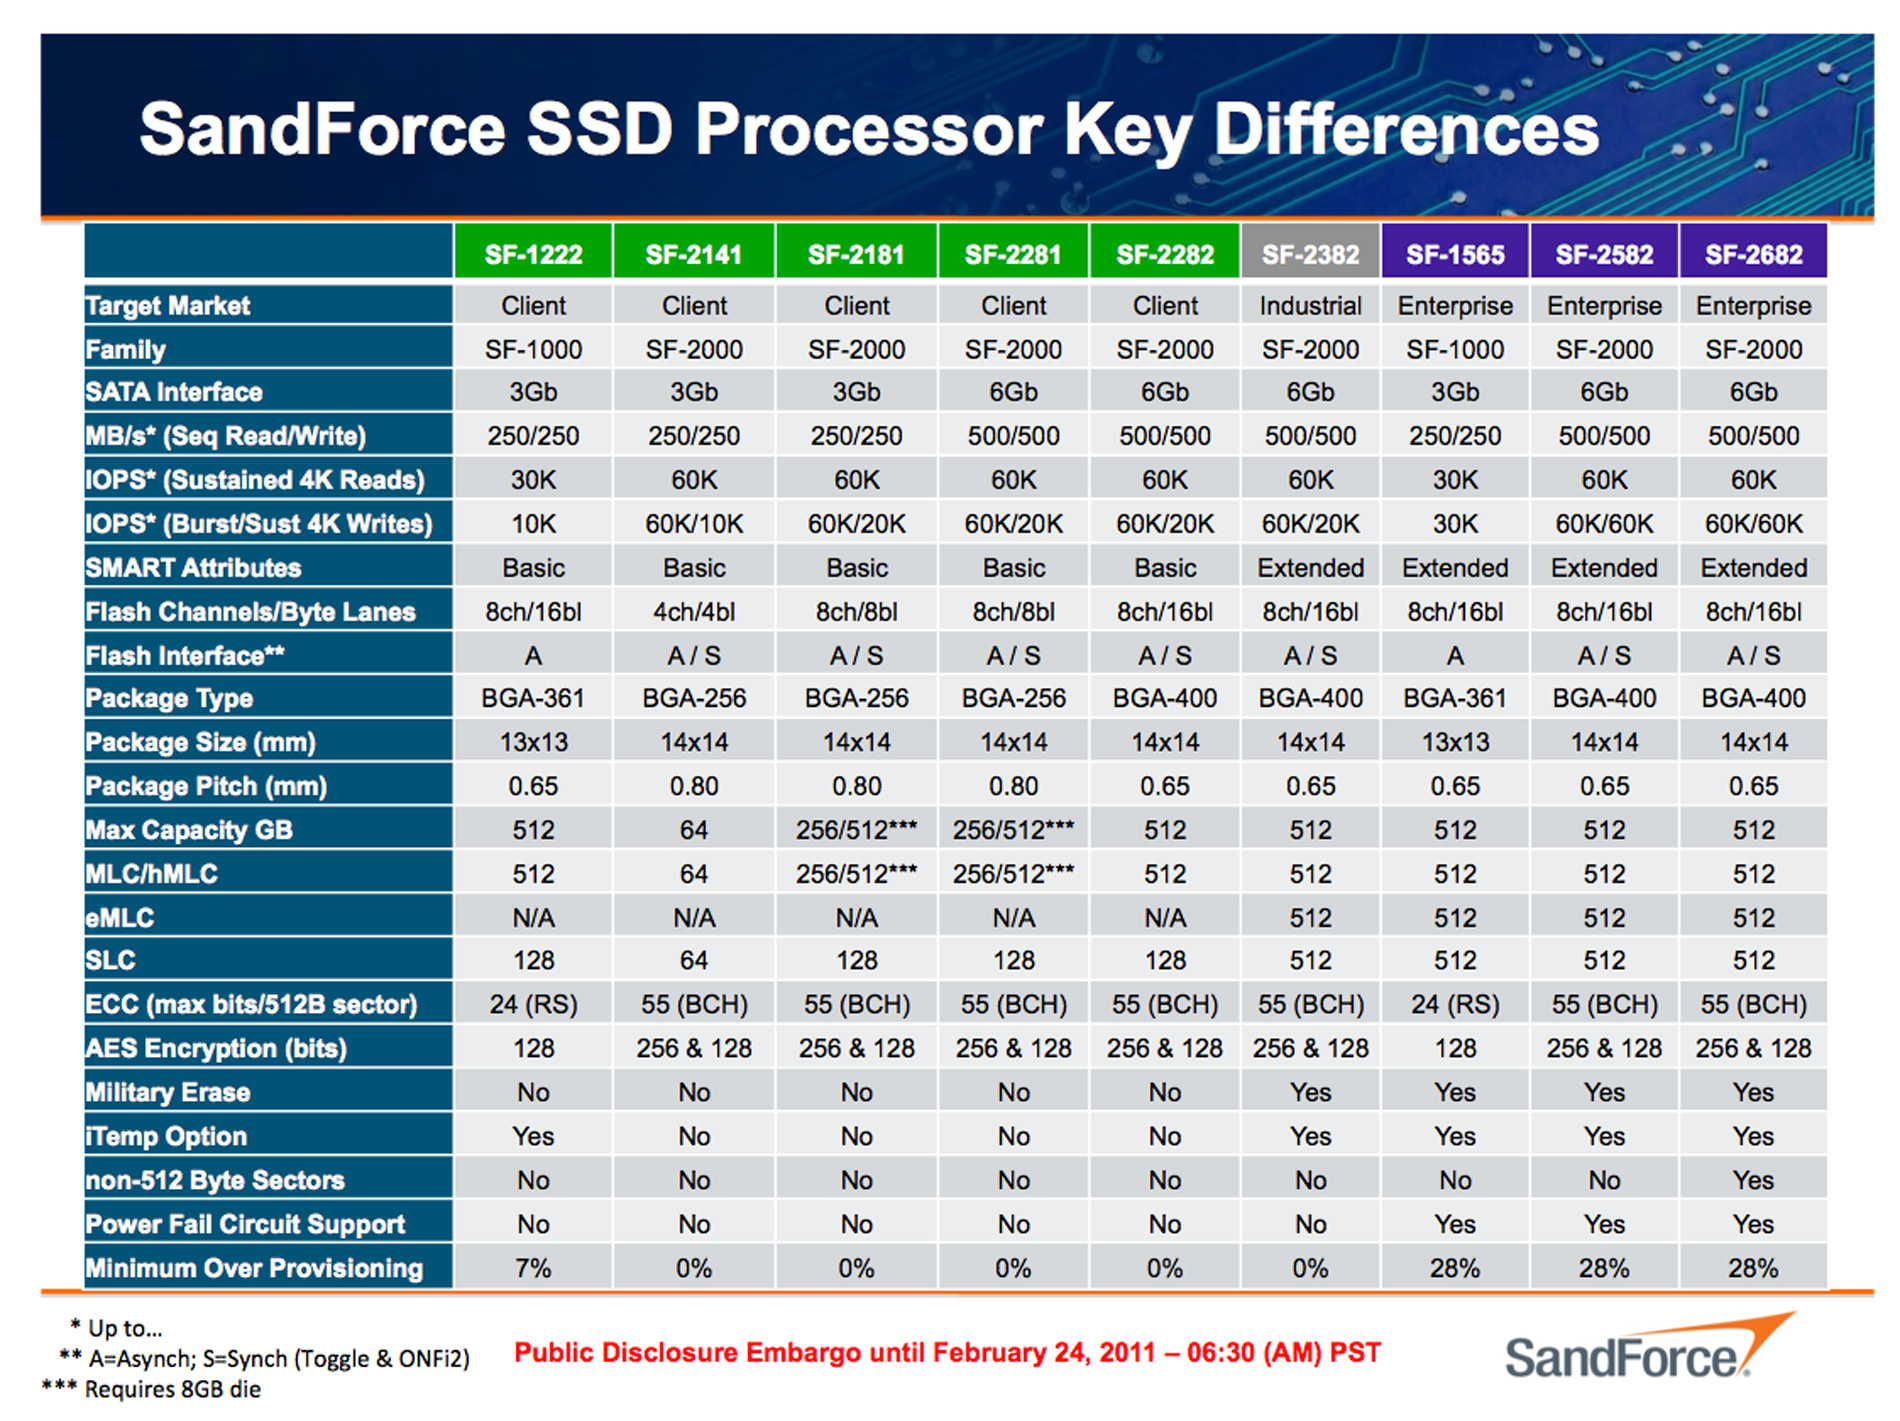
You should first know that SandForce only produces a single die, the differences between all of the members of the SF-2000 family are strictly packaging, firmware and testing.
The main categories here are SF-2100, SF-2200, SF-2500 and SF-2600. The 2500/2600 parts are focused on the enterprise. They’re put through more aggressive testing, their firmware supports enterprise specific features and they support the use of a supercap to minimize dataloss in the event of a power failure. The difference between the SF-2582 and the SF-2682 boils down to one feature: support for non-512B sectors. Whether or not you need support for this really depends on the type of system it’s going into. Some SANs demand non-512B sectors in which case the SF-2682 is the right choice.
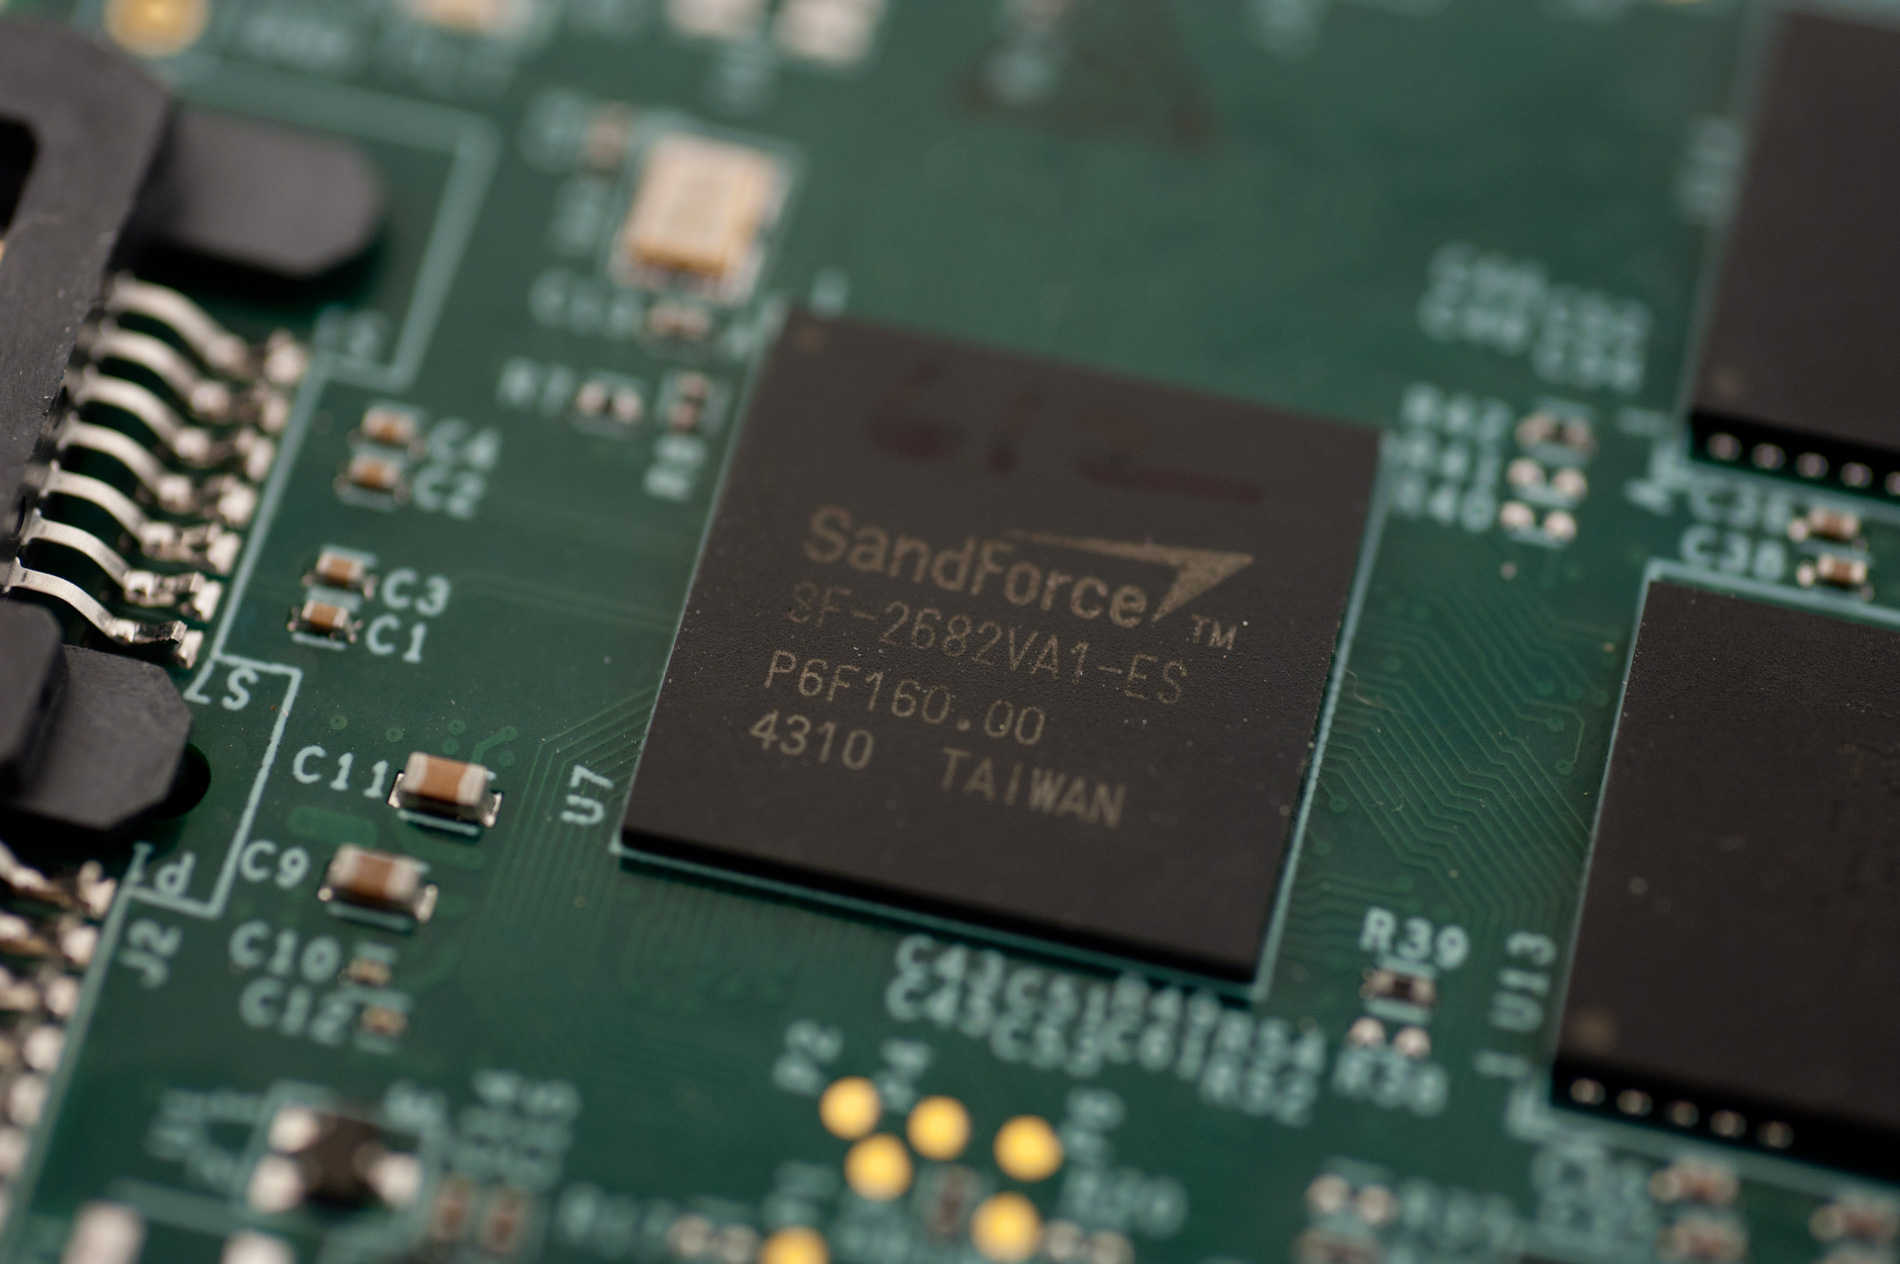
You may remember that our Vertex 3 Pro sample used a SF-2682 controller. That’s because initially all SandForce made were SF-2682s. Final versions of the V3P will likely use the cheaper SF-2582.
The SF-2200/2100 series are more interesting because of their lower target price points. You lose support for the supercap but that’s not as big of a deal on the desktop since you’re not working with mission critical data. The big difference between the 2200 and 2100 is support for 6Gbps SATA, the former supports it while the latter doesn’t. This is a pretty big difference because as we’ve seen, when paired with a 3Gbps controller the SF-2000 isn’t too much better than what we had with the SF-1000.
The other big difference is the number of byte lanes supported by the controller. The SF-2181 and above all support 8 NAND flash channels, however only the SF-2282 supports 16 byte lanes. Each NAND device is 8 bytes wide, supporting 16 byte lanes means that each channel can be populated by two NAND devices. This lets a single SF-2282 controller talk to twice as many NAND devices as a SF-2281.
There’s no performance difference between the 8 and 16-byte lane versions of the chip, it’s just a matter of pure capacity. Thankfully with 25nm NAND you can get 8GB of MLC NAND on a single die so both the 2281 and 2282 should be able to hit 512GB capacities (the 2281 simply needs higher density NAND packages).
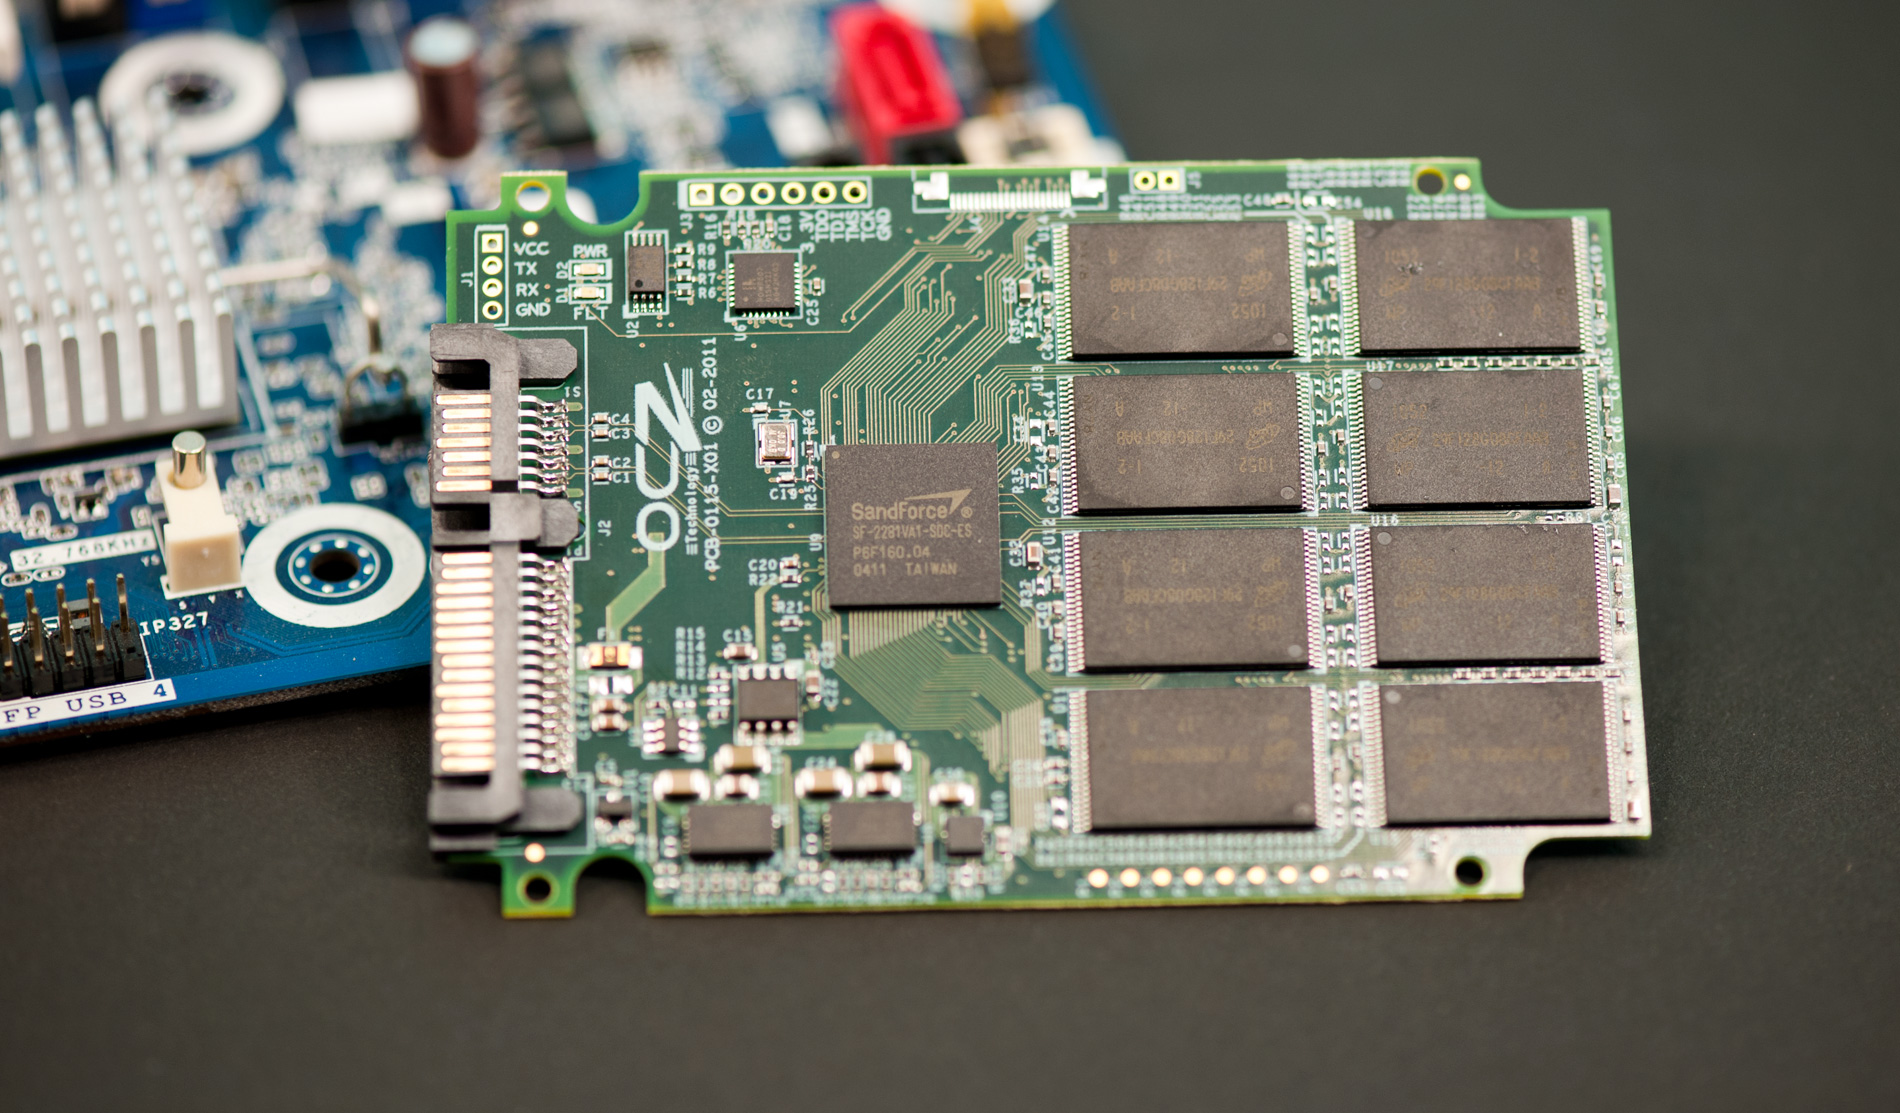
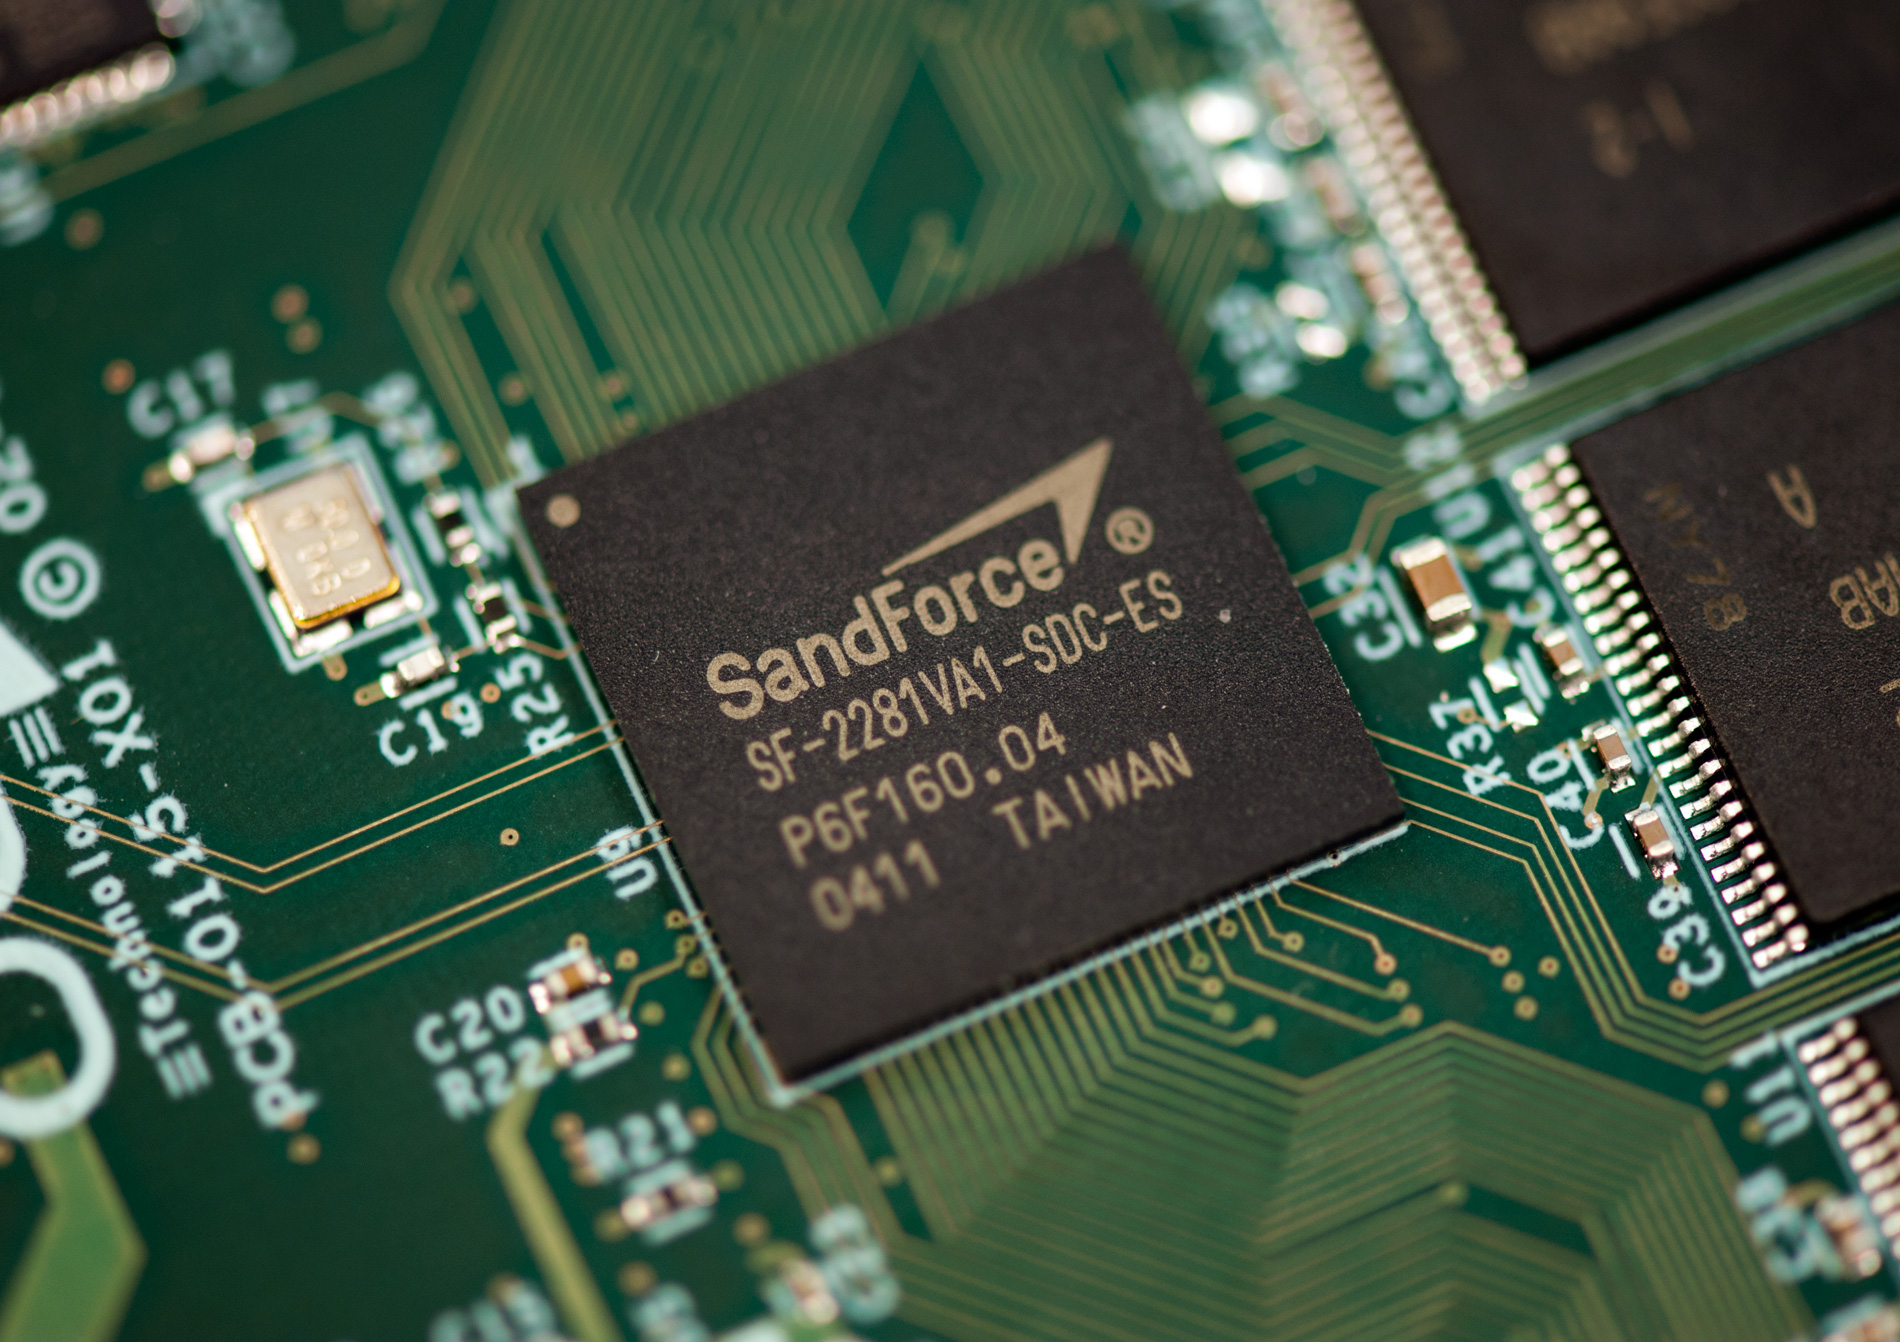
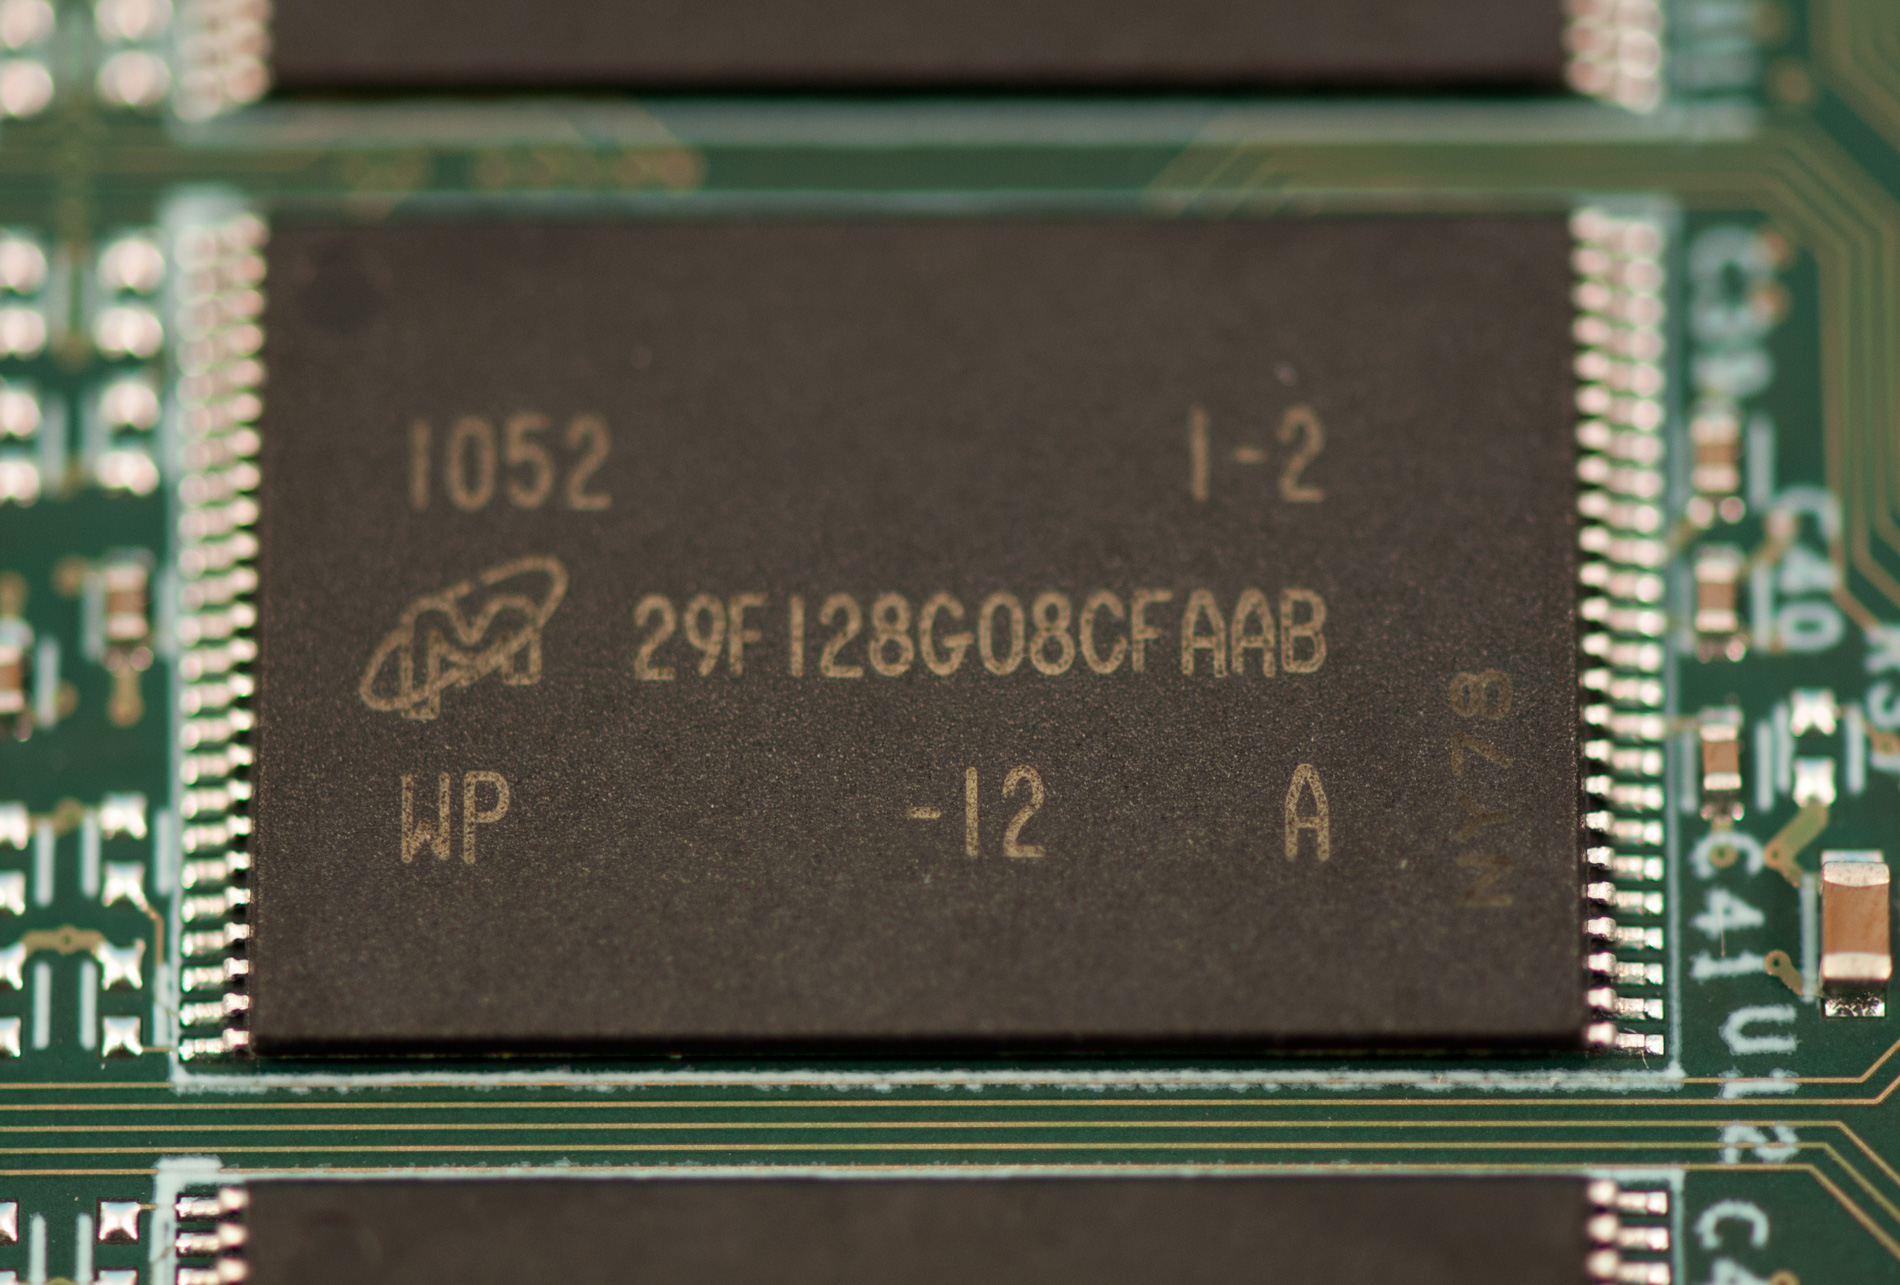
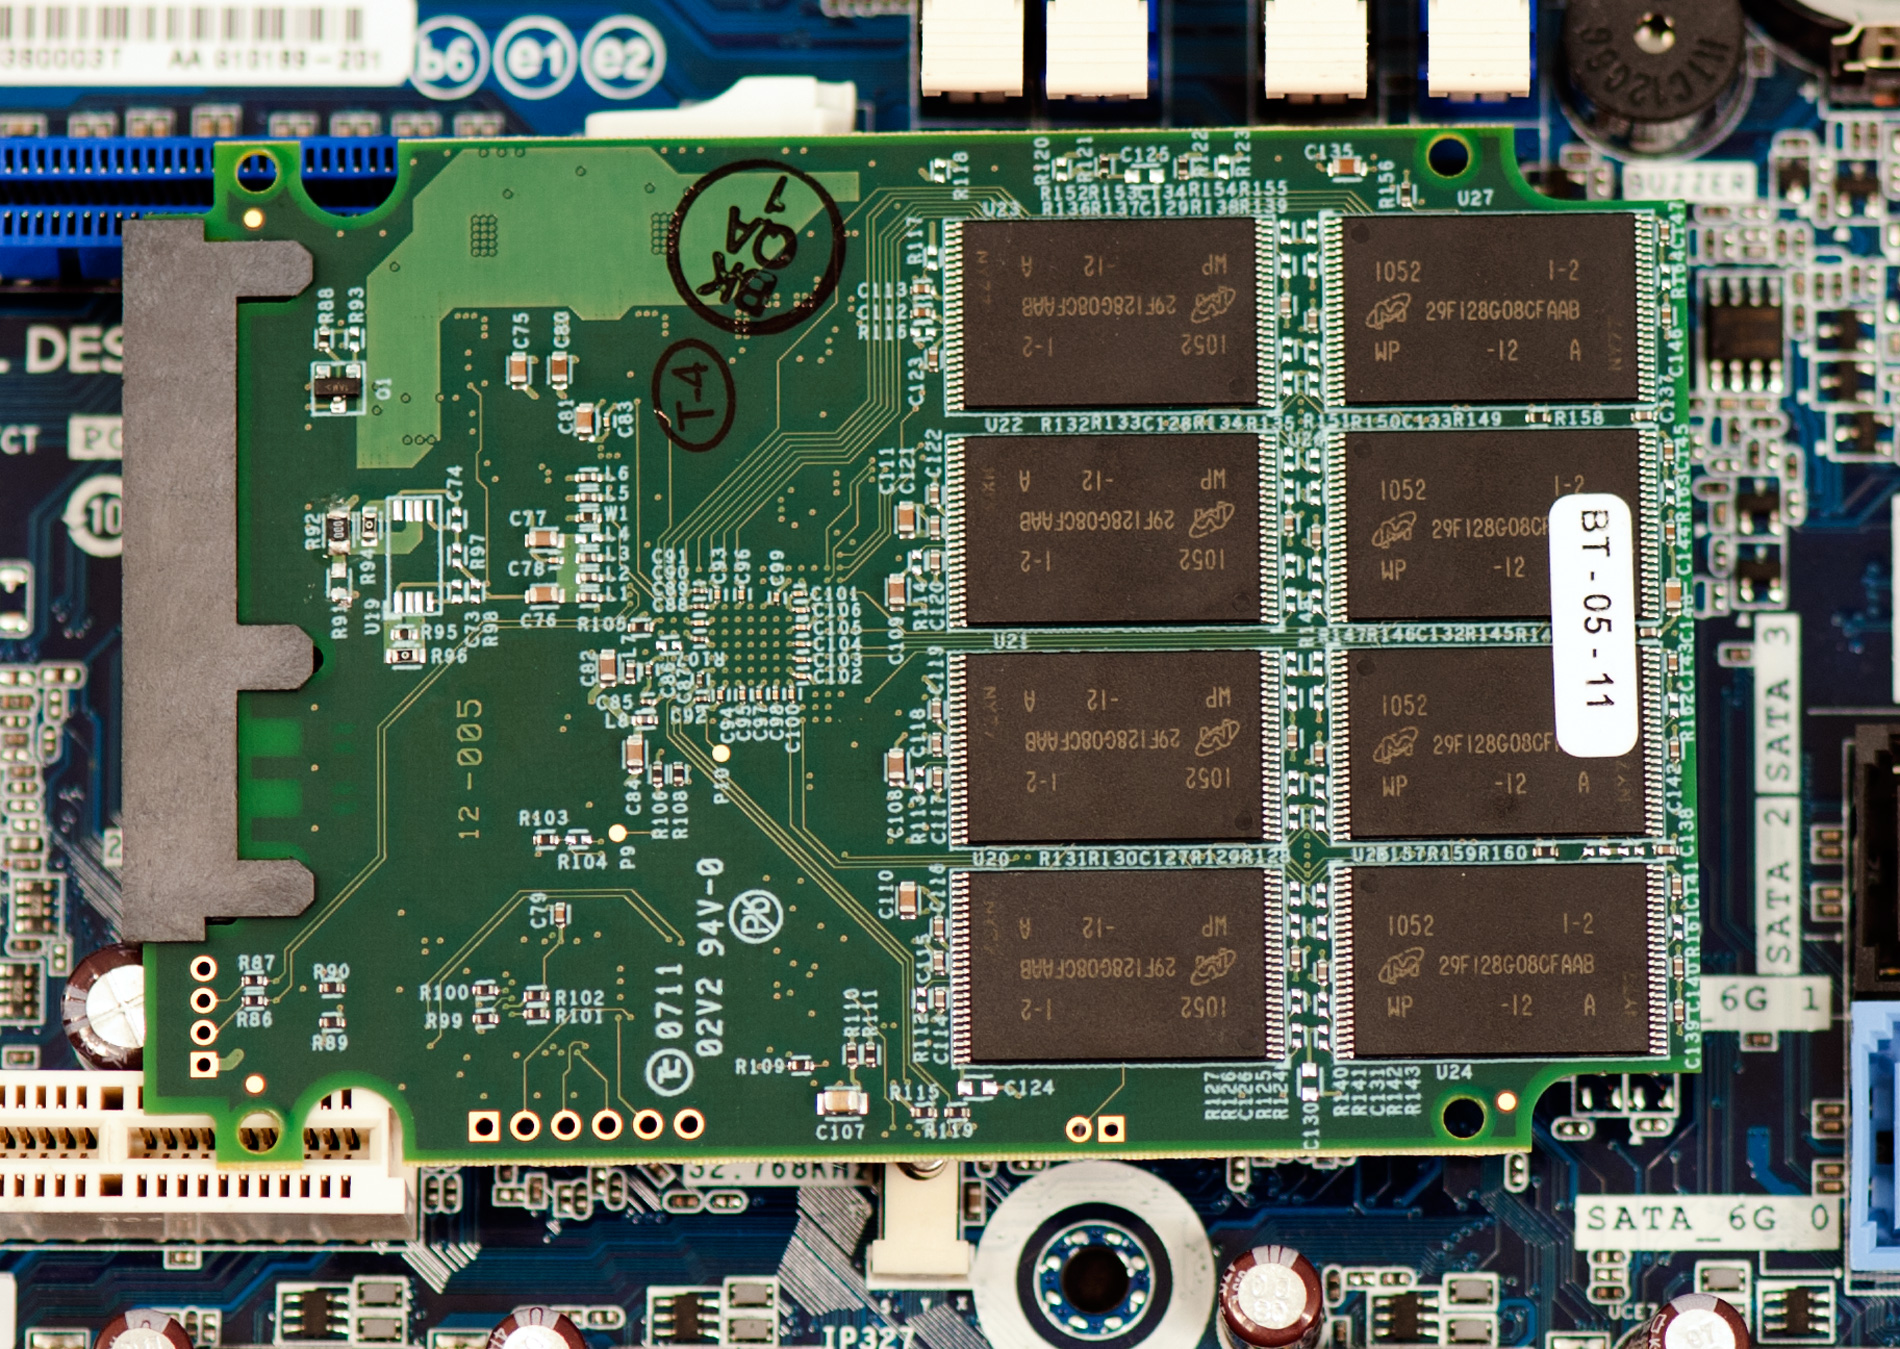
The Vertex 3 sample we have here today uses the SF-2281. Our sample came configured with sixteen 16GB Micron 25nm ONFI 2.0 NAND devices. Remember that while both Intel and Micron own the 25nm fabs, the two companies are providing different specs/yields on 25nm NAND. The 25nm Micron stuff is rated at around 3,000 p/e cycles from what I’ve heard, while the Intel 25nm is rated at 5,000. The main difference here is that the Micron is available in great quantities today while the Intel 25nm isn’t.
RAISE: Optional
One other difference between the SF-2500/2600 and the SF-2100/2200 is the optional nature of RAISE. You'll remember that in order to allow for lower quality NAND SandForce stripes a small amount of redundant data across the array of NAND in a SF-1000/2000 drive. SandForce never stores your actual data, rather a smaller hash/representation of your data. When your data is compressed/deduped for storage, SandForce's controller also generates parity data equal to the size of a single NAND die in the array. This process is known as RAISE (Redundant Array of Independent Silicon Elements) and it allows you to lose as much as a full NAND die worth of data and still never see a bit of data loss from the user's standpoint. At 25nm however a single die can be as large as 8GB, which on a lower capacity drive can be a significant percentage of the total drive capacity.
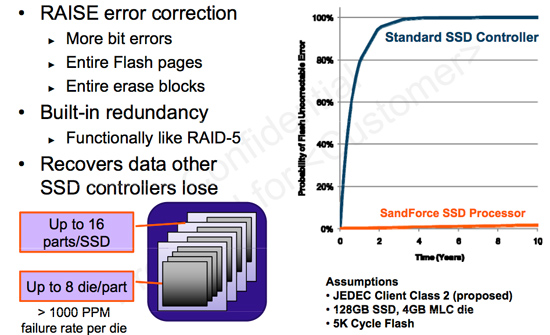
With the SF-2100/2200, SandForce allows the manufacturer to disable RAISE entirely. At that point you're left with the new 55-bit BCH ECC engine to do any error correcting. According to SandForce the new BCH ECC engine is sufficient for dealing with errors you'd see on 25nm NAND and RAISE isn't necessary for desktop workloads. Drive makers are currently contemplating what to do with RAISE but as of now the Vertex 3 is set to ship with it enabled. The drive we have here today has 256GB of NAND, it'll be advertised as a 240GB drive and appear as a 223.5GB drive in Windows.
Here We Go Again: 4KB Random Write IOP Caps
With the SF-1200 SandForce capped the peak 4KB random write speed of certain drives while negotiating exclusive special firmware deals with other companies to enable higher performance. It was all very confusing as SandForce shipped initial firmware revisions with higher performance and later attempted to take that performance away through later firmware updates.
If you pay attention to the table above you’ll notice that there are two specs for 4KB random write IOPS: burst and sustained. The burst value is for around 15 seconds of operation, the sustained is what happens when the firmware initiated performance cap kicks into action. By default the SF-2100/2200 drives have a cap of 20,000 IOPS for 4KB random writes. After a period of about 15 seconds, the max performance on these drives will drop to 20K. The SF-2500/2600 controllers are uncapped, max performance can remain at up to 60K IOPS.
The beta Vertex 3 review sample I have here today manages around 45K IOPS in our 4KB random write test. That test runs for 3 minutes straight so obviously the cap should’ve kicked in. However it didn’t.
I asked SandForce why this was. SandForce told me that the initial pre-release firmwares on the SF-2200 drives don’t have the cap enabled, but the final release will put the cap in place. I also asked SandForce if it was possible for one of its partners to ship with a special firmware build that didn’t have the cap in place. SandForce replied that anything was possible.
I asked OCZ if this meant the drive I was testing wasn’t representative of final, shipping performance. OCZ stated very clearly that performance will not change between the drive I have today and the drive that goes on sale in the next 2 months. To me this sounds like SF and OCZ have struck another exclusive firmware deal to ensure slightly higher performance on the Vertex 3 compared to a standard SF-2200 based drive.
SandForce wouldn’t comment on any existing agreements and OCZ said it couldn’t get SandForce to confirm that the V3’s performance wouldn’t change between now and its eventual release. Based on what we saw last time I expect SandForce to offer the 60K IOPS firmware to all partners that meet certain order size commitments. Order enough controllers and you get a special firmware, otherwise you’re stuck with the stock SF-2200 firmware.
Of course this makes things very confusing for those of you looking to shop around when buying a SF-2200 drive. I do wish SandForce would just stick to a single spec and not play these sorts of games but that’s just how business works unfortunately.
The good news is that for most desktop workloads you don’t really benefit from being able to execute more than 20K IOPS, at least in today’s usage models.
Faster than the Vertex 3 Pro?
SandForce’s specs put the SF-2281 at up to 500MB/s reads and writes, just like the SF-2582/2682. OCZ’s specs for the Vertex 3 however put it slightly above the performance of the Vertex 3 Pro:
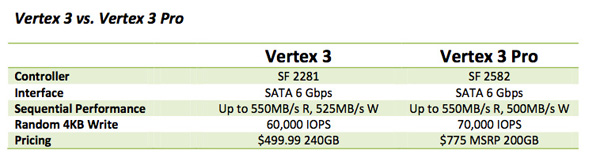
I asked SandForce to explain the discrepancy. It turns out that SandForce doesn’t really enforce its specs on its partners. It’s up to the partner to test and advertise whatever it would like as long as it can back those claims up. In this case, the Micron 25nm NAND appears to perform a bit better than the 32nm Toshiba NAND that was used on the Vertex 3 Pro. As a result, sequential write speeds are slightly higher.
OCZ also rates the Vertex 3 as having slightly lower random write performance than the Vertex 3 Pro, but the difference is not that great in practice.
For desktop performance this does mean that the Vertex 3 will likely be a bit faster than the Vertex 3 Pro we previewed a week ago. You trade off enterprise level features for price, but you don't sacrifice performance.
The Test
I'll point out once more that this is beta hardware running beta firmware. I've only had the Vertex 3 for a matter of days before publishing this and that's honestly not enough time to put it through anything more than a handful of performance tests. Real reliability and bug testing will take weeks if not months. Keep that in mind if you decide to be an early adopter on one of these drives.
| CPU | Intel Core i7 965 running at 3.2GHz (Turbo & EIST Disabled) Intel Core i7 2600K running at 3.4GHz (Turbo & EIST Disabled) - for AT SB 2011 |
| Motherboard: | Intel DX58SO (Intel X58) Intel H67 Motherboard |
| Chipset: | Intel X58 + Marvell SATA 6Gbps PCIe Intel H67 |
| Chipset Drivers: | Intel 9.1.1.1015 + Intel IMSM 8.9 Intel 9.1.1.1015 + Intel RST 10.2 |
| Memory: | Qimonda DDR3-1333 4 x 1GB (7-7-7-20) |
| Video Card: | eVGA GeForce GTX 285 |
| Video Drivers: | NVIDIA ForceWare 190.38 64-bit |
| Desktop Resolution: | 1920 x 1200 |
| OS: | Windows 7 x64 |
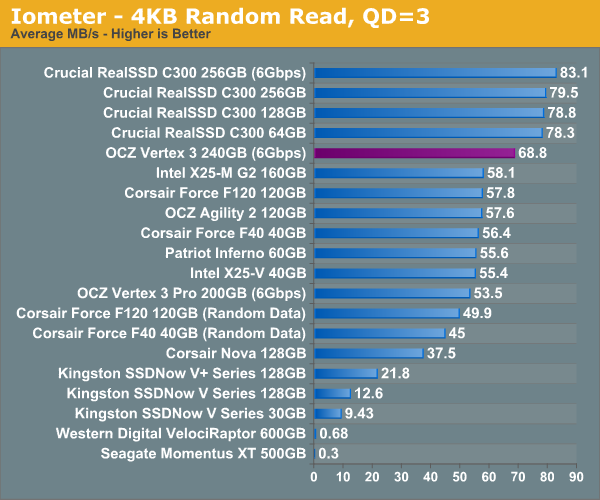
Random Read/Write Speed
The four corners of SSD performance are as follows: random read, random write, sequential read and sequential write speed. Random accesses are generally small in size, while sequential accesses tend to be larger and thus we have the four Iometer tests we use in all of our reviews.
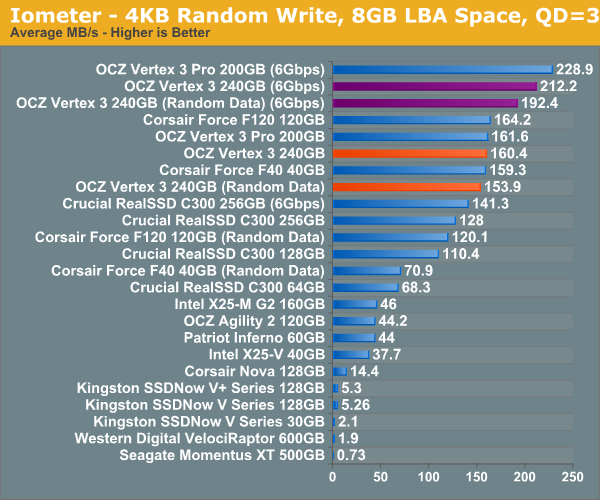
Our first test writes 4KB in a completely random pattern over an 8GB space of the drive to simulate the sort of random access that you'd see on an OS drive (even this is more stressful than a normal desktop user would see). I perform three concurrent IOs and run the test for 3 minutes. The results reported are in average MB/s over the entire time. We use both standard pseudo randomly generated data for each write as well as fully random data to show you both the maximum and minimum performance offered by SandForce based drives in these tests. The average performance of SF drives will likely be somewhere in between the two values for each drive you see in the graphs. For an understanding of why this matters, read our original SandForce article.
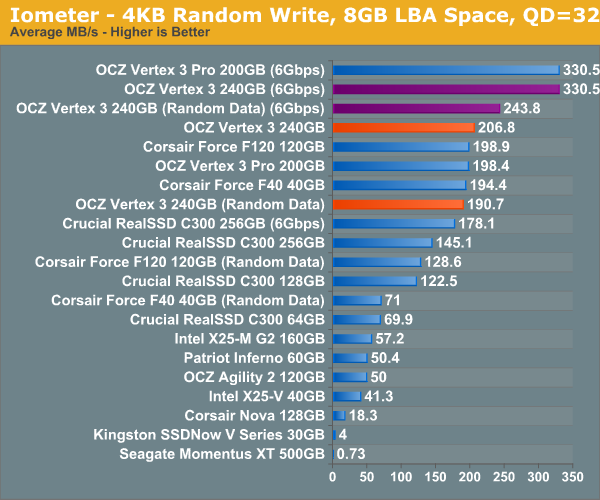
Many of you have asked for random write performance at higher queue depths. What I have below is our 4KB random write test performed at a queue depth of 32 instead of 3. While the vast majority of desktop usage models experience queue depths of 0 - 5, higher depths are possible in heavy I/O (and multi-user) workloads:
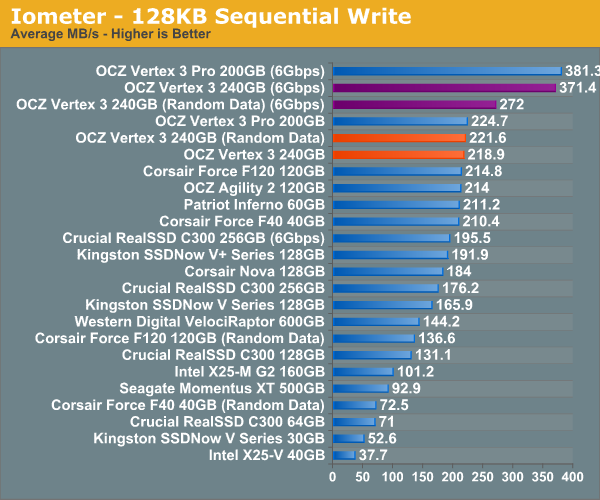
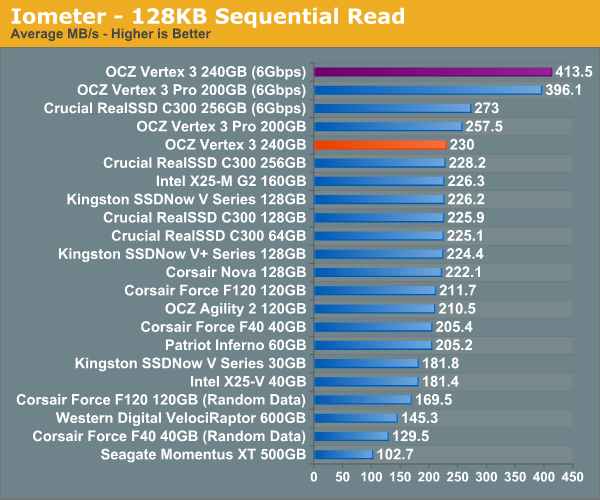
Sequential Read/Write Speed
To measure sequential performance I ran a 3 minute long 128KB sequential test over the entire span of the drive at a queue depth of 1. The results reported are in average MB/s over the entire test length.
AnandTech Storage Bench 2011: Much Heavier
I didn't expect to have to debut this so soon, but I've been working on updated benchmarks for 2011. Last year we introduced our AnandTech Storage Bench, a suite of benchmarks that took traces of real OS/application usage and played them back in a repeatable manner. I assembled the traces myself out of frustration with the majority of what we have today in terms of SSD benchmarks.
Although the AnandTech Storage Bench tests did a good job of characterizing SSD performance, they weren't stressful enough. All of the tests performed less than 10GB of reads/writes and typically involved only 4GB of writes specifically. That's not even enough exceed the spare area on most SSDs. Most canned SSD benchmarks don't even come close to writing a single gigabyte of data, but that doesn't mean that simply writing 4GB is acceptable.
Originally I kept the benchmarks short enough that they wouldn't be a burden to run (~30 minutes) but long enough that they were representative of what a power user might do with their system.
Not too long ago I tweeted that I had created what I referred to as the Mother of All SSD Benchmarks (MOASB). Rather than only writing 4GB of data to the drive, this benchmark writes 106.32GB. It's the load you'd put on a drive after nearly two weeks of constant usage. And it takes a *long* time to run.
I'll be sharing the full details of the benchmark in some upcoming SSD articles (again, I wasn't expecting to have to introduce this today so I'm a bit ill prepared) but here are some details:
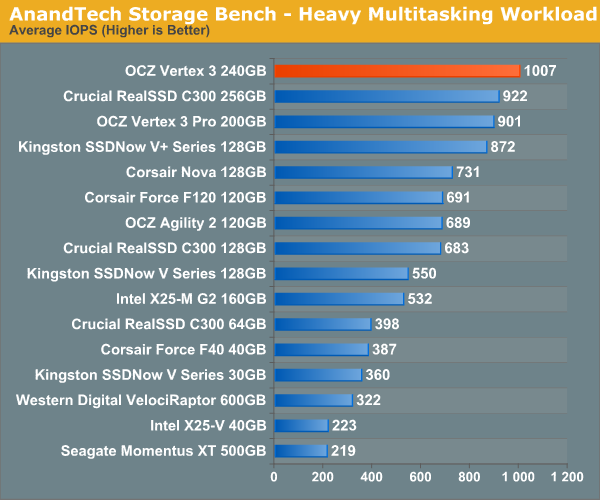
1) The MOASB, officially called AnandTech Storage Bench 2011 - Heavy Workload, mainly focuses on the times when your I/O activity is the highest. There is a lot of downloading and application installing that happens during the course of this test. My thinking was that it's during application installs, file copies, downloading and multitasking with all of this that you can really notice performance differences between drives.
2) I tried to cover as many bases as possible with the software I incorporated into this test. There's a lot of photo editing in Photoshop, HTML editing in Dreamweaver, web browsing, game playing/level loading (Starcraft II & WoW are both a part of the test) as well as general use stuff (application installing, virus scanning). I included a large amount of email downloading, document creation and editing as well. To top it all off I even use Visual Studio 2008 to build Chromium during the test.
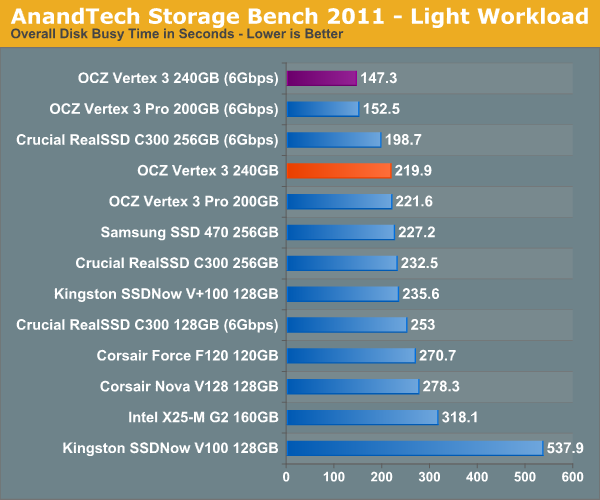
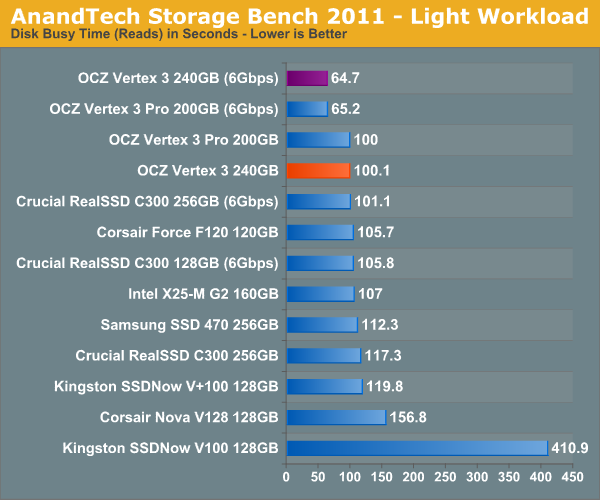
Many of you have asked for a better way to really characterize performance. Simply looking at IOPS doesn't really say much. As a result I'm going to be presenting Storage Bench 2011 data in a slightly different way. We'll have performance represented as Average MB/s, with higher numbers being better. At the same time I'll be reporting how long the SSD was busy while running this test. These disk busy graphs will show you exactly how much time was shaved off by using a faster drive vs. a slower one during the course of this test. Finally, I will also break out performance into reads, writes and combined. The reason I do this is to help balance out the fact that this test is unusually write intensive, which can often hide the benefits of a drive with good read performance.
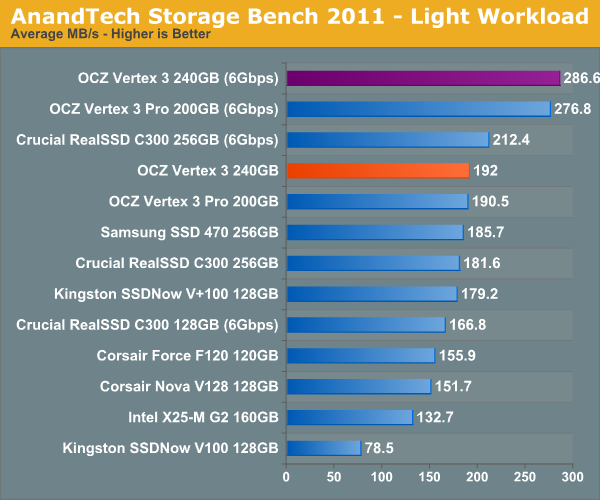
There's also a new light workload for 2011. This is a far more reasonable, typical every day use case benchmark. Lots of web browsing, photo editing (but with a greater focus on photo consumption), video playback as well as some application installs and gaming. This test isn't nearly as write intensive as the MOASB but it's still multiple times more write intensive than what we were running last year.
As always I don't believe that these two benchmarks alone are enough to characterize the performance of a drive, but hopefully along with the rest of our tests they will help provide a better idea.
The testbed for Storage Bench 2011 has changed as well. We're now using a Sandy Bridge platform with full 6Gbps support for these tests. All of the older tests are still run on our X58 platform.
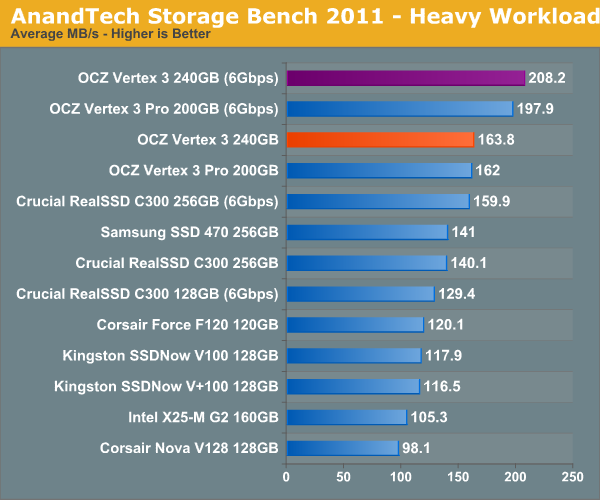
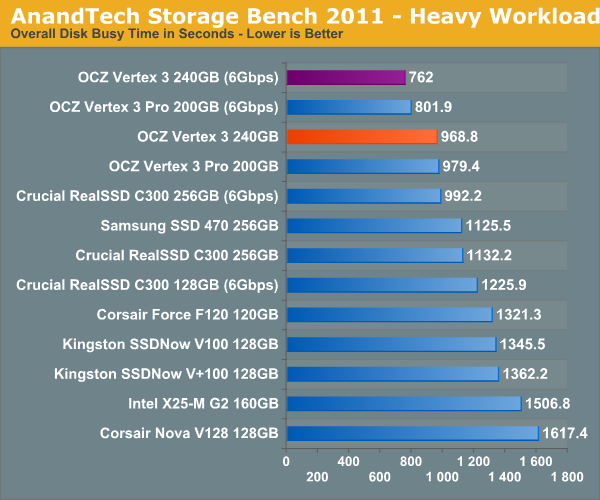
AnandTech Storage Bench 2011 - Heavy Workload
We'll start out by looking at average data rate throughout our new heavy workload test:
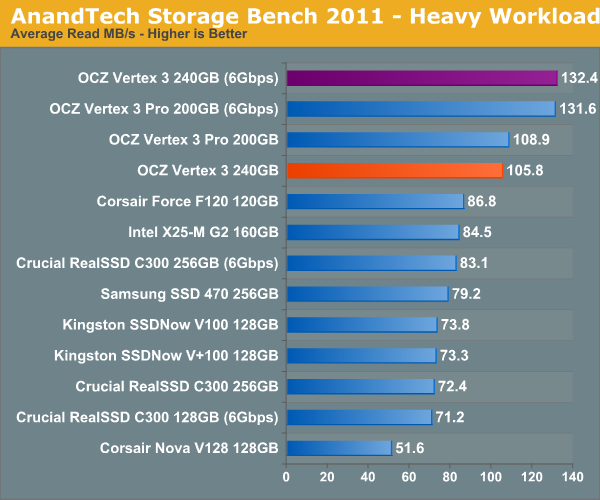
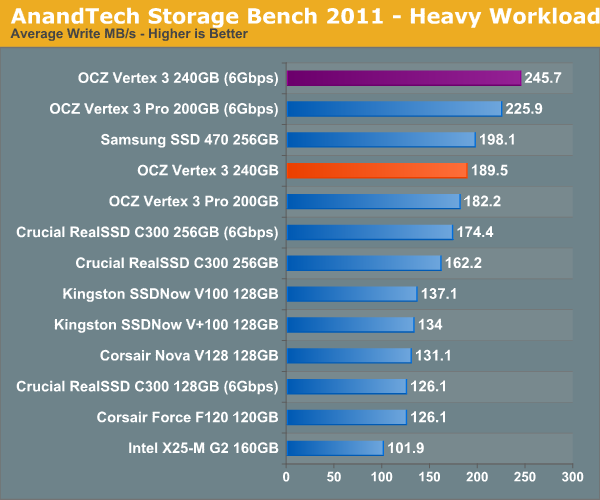
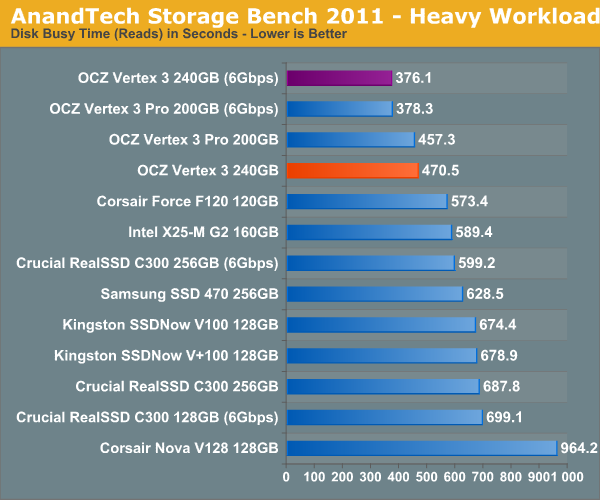
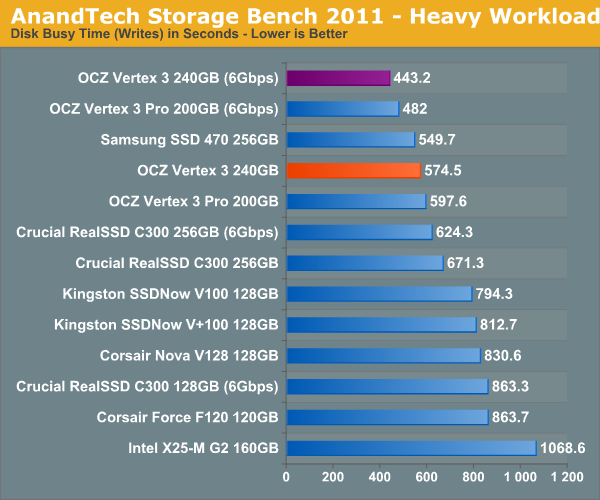
If we break out our performance results into average read and write speed we get a better idea for the Vertex 3's strengths:
The next three charts just represent the same data, but in a different manner. Instead of looking at average data rate, we're looking at how long the disk was busy for during this entire test. Note that disk busy time excludes any and all idles, this is just how long the SSD was busy doing something:
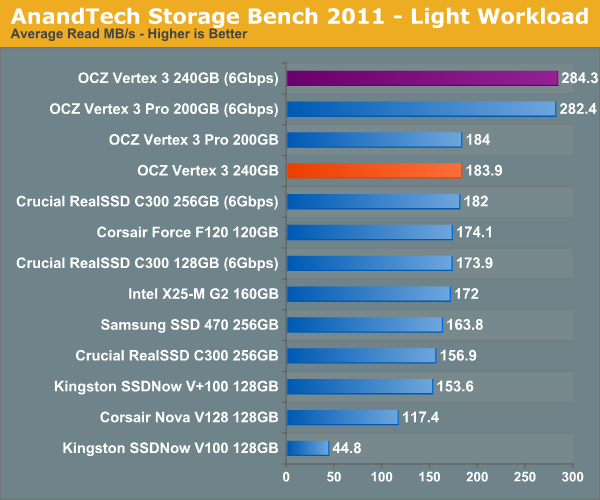
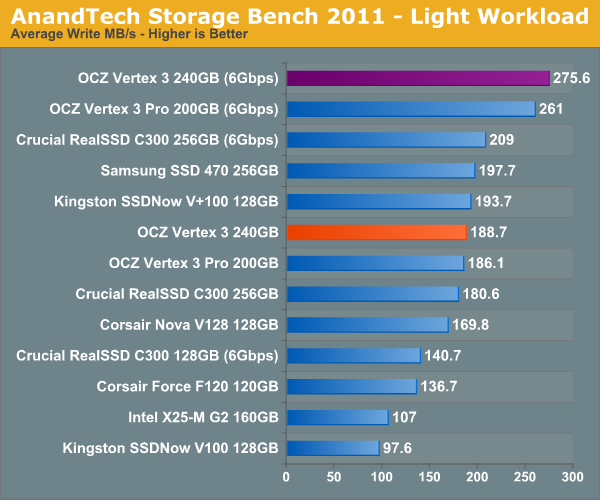
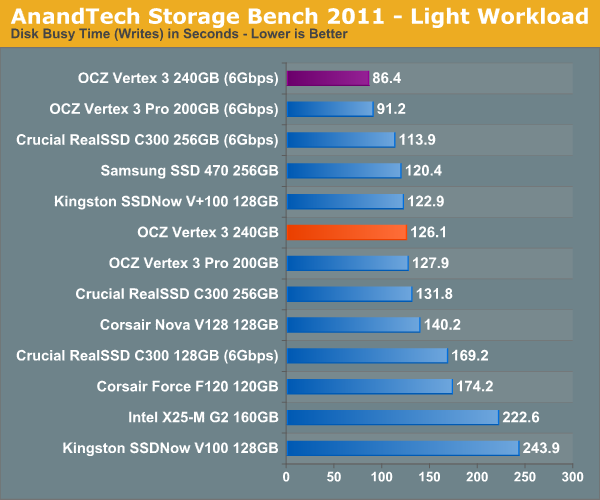
AnandTech Storage Bench 2011 - Light Workload
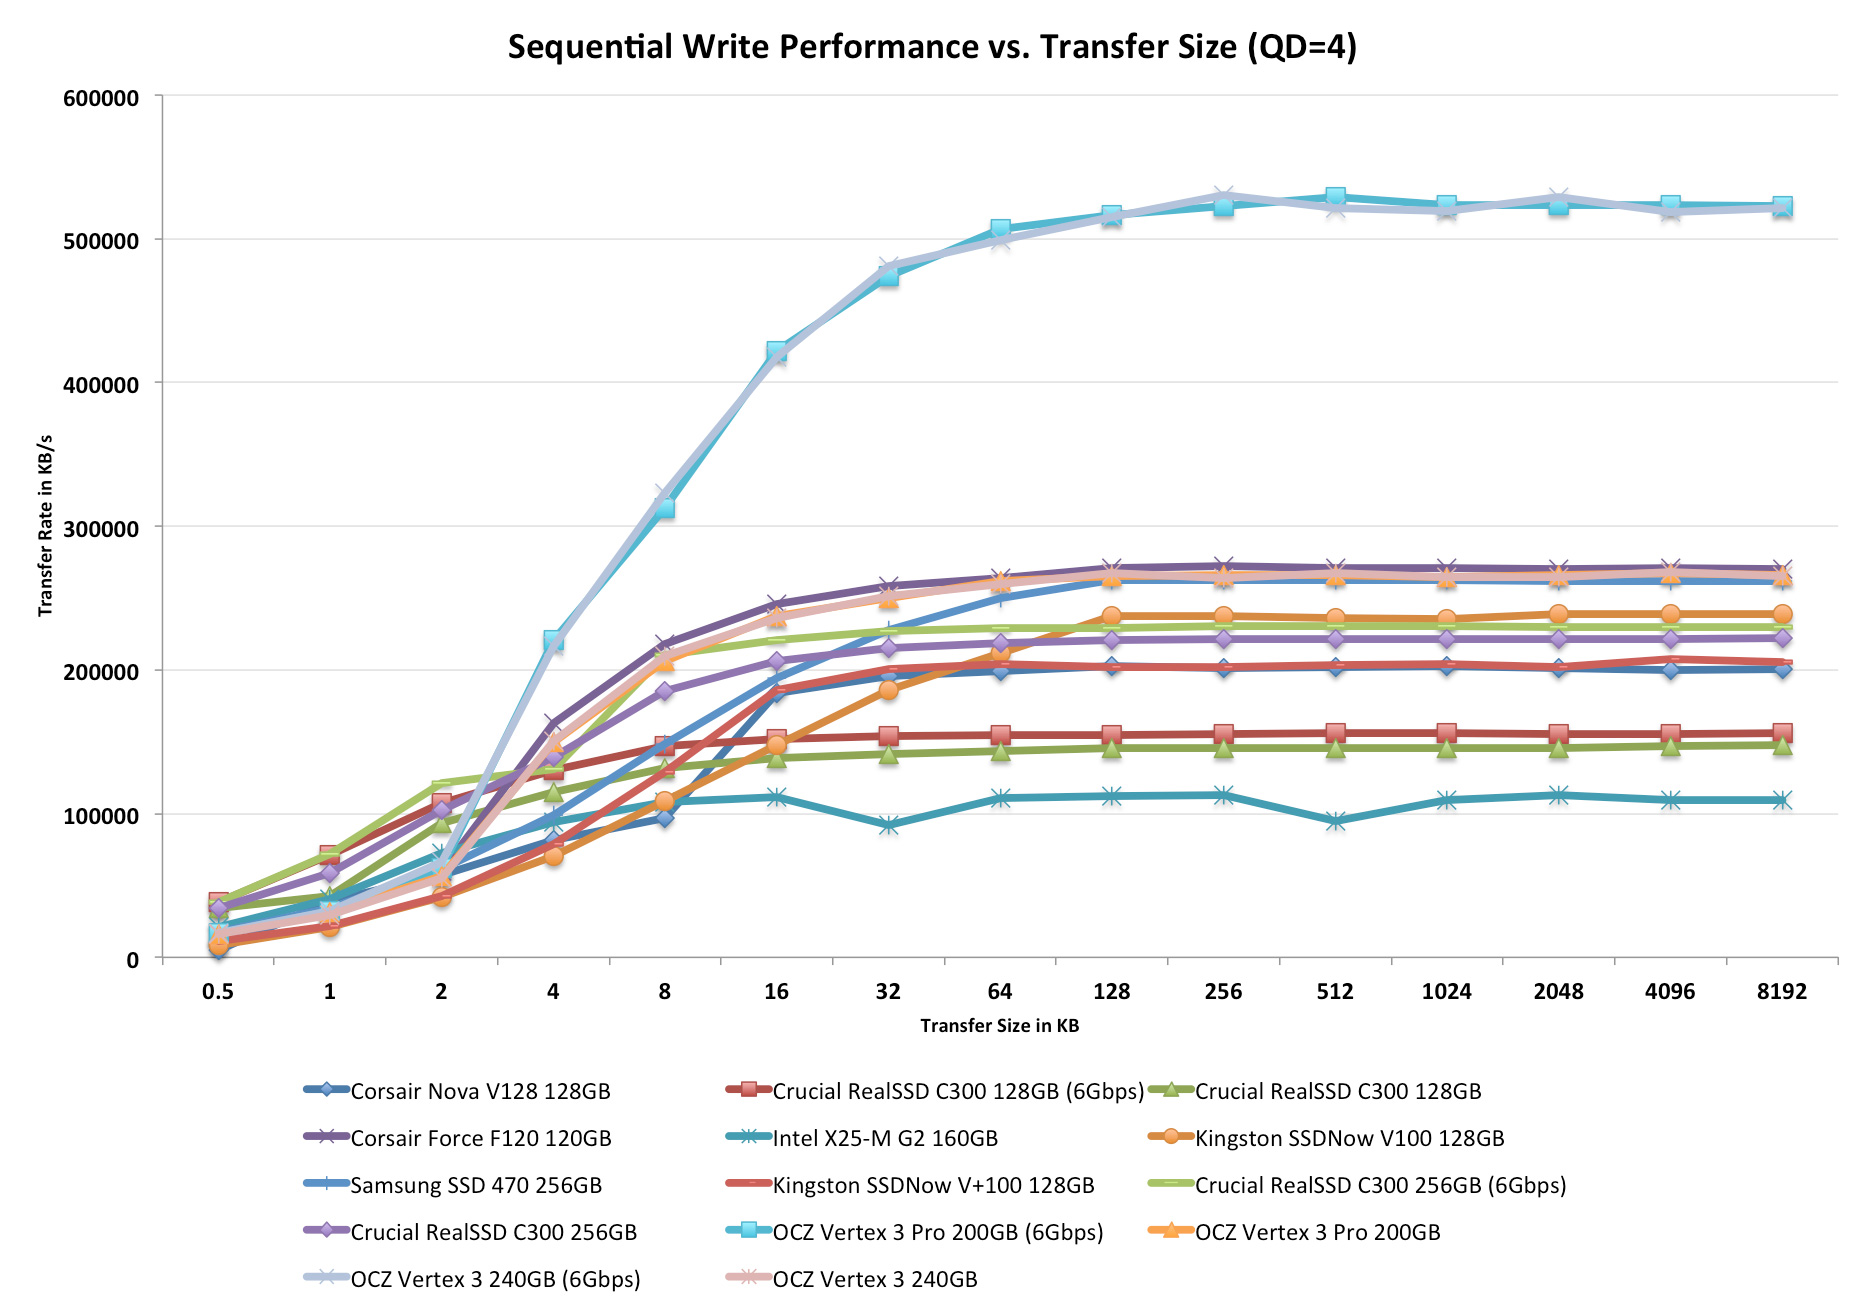
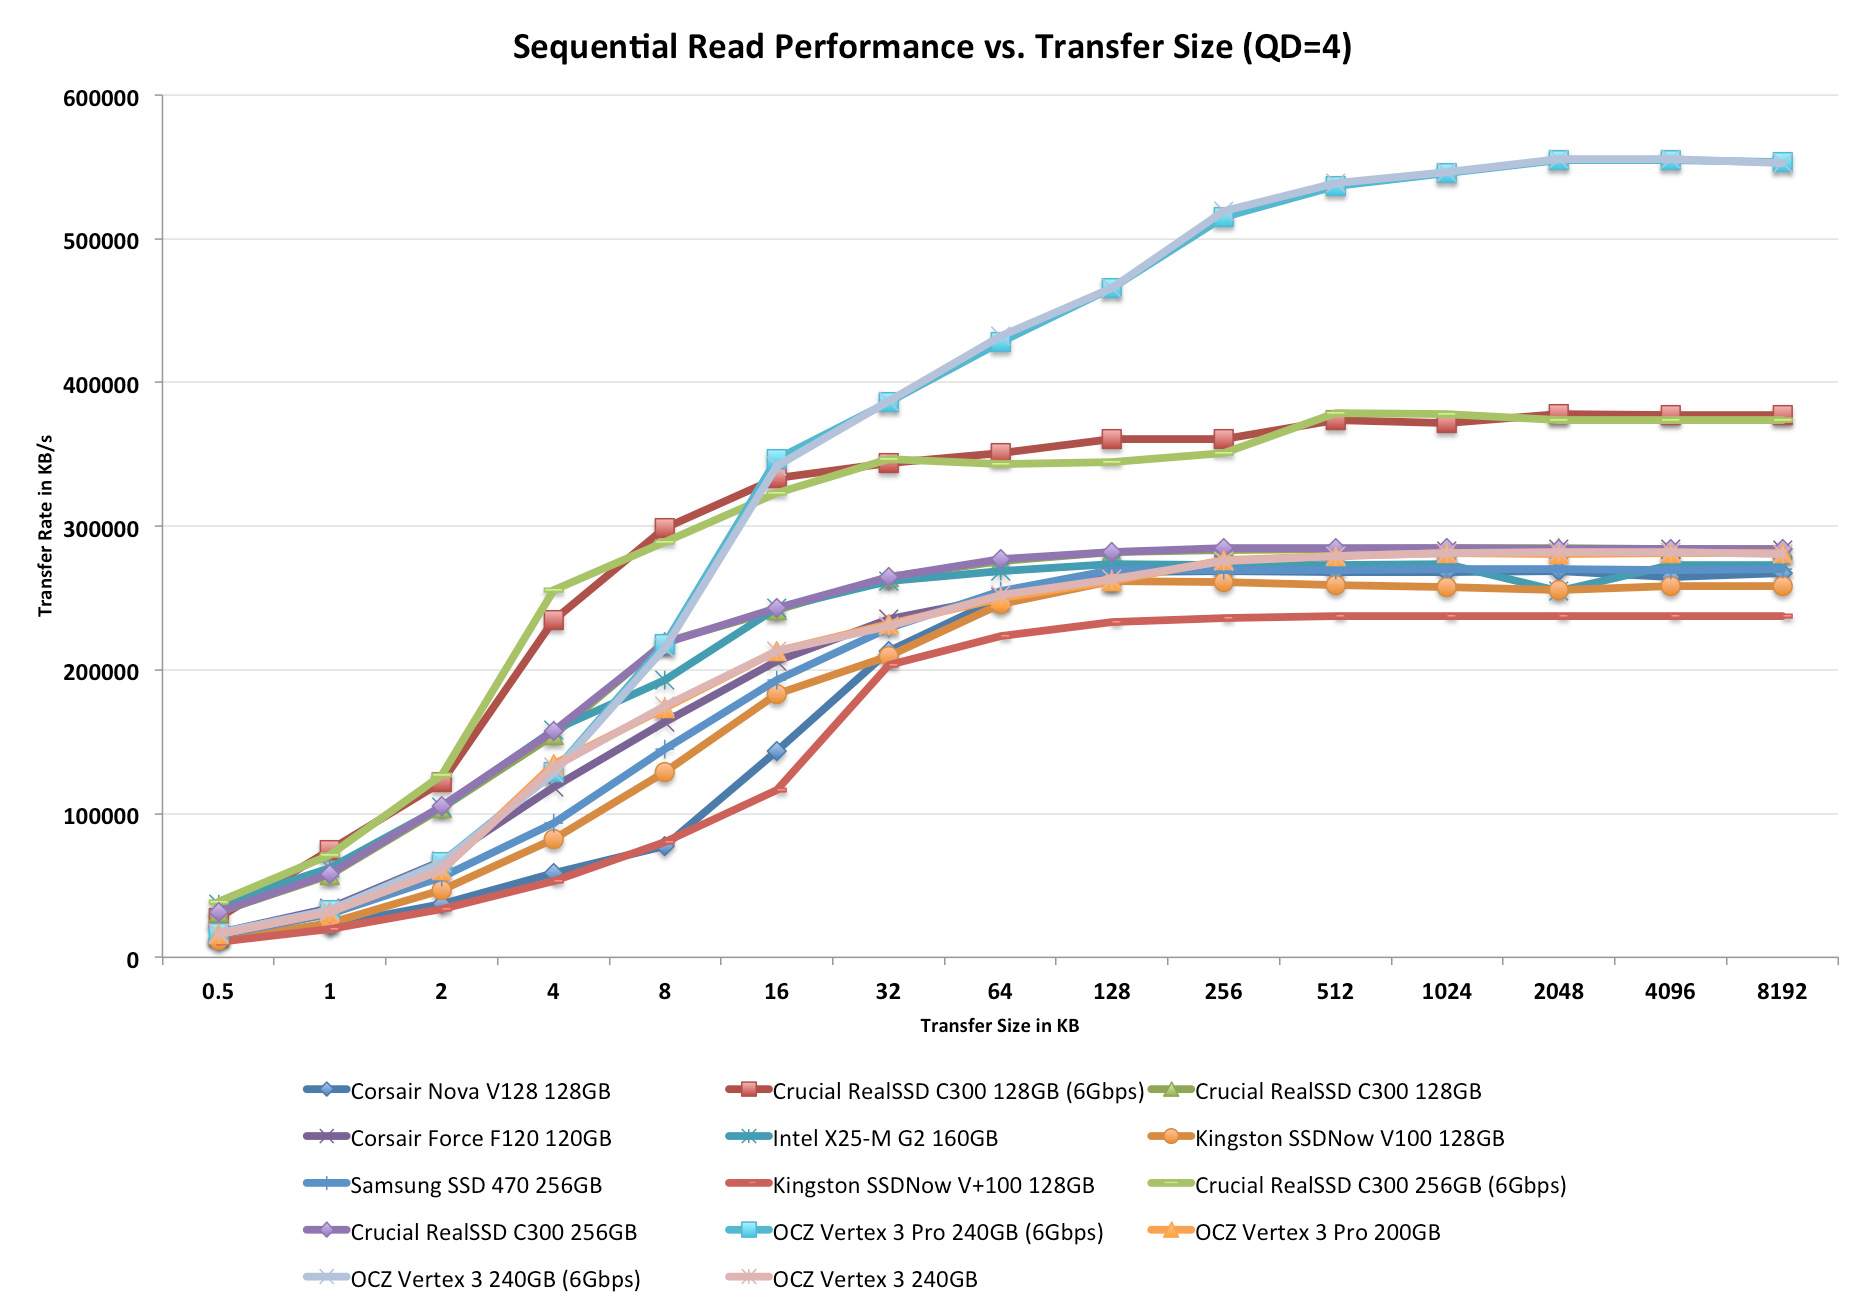
Performance vs. Transfer Size
All of our Iometer sequential tests happen at a queue depth of 1, which is indicative of a light desktop workload. It isn't too far fetched to see much higher queue depths on the desktop. The performance of these SSDs also greatly varies based on the size of the transfer. For this next test we turn to ATTO and run a sequential write over a 2GB span of LBAs at a queue depth of 4 and varying the size of the transfers.
As we've already seen everywhere else, the Vertex 3 performs identically to the Vertex 3 Pro - it's just cheaper.
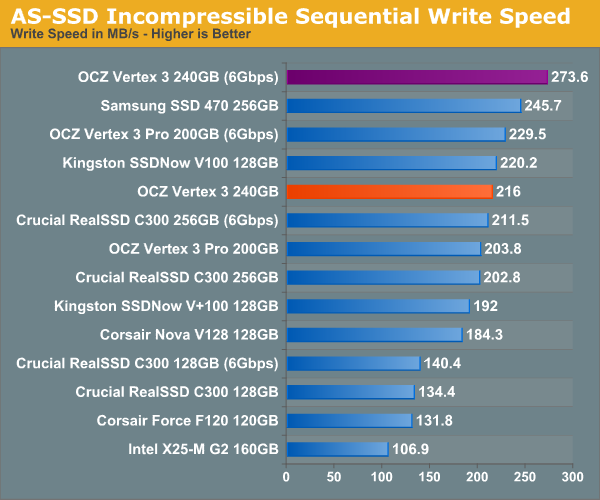
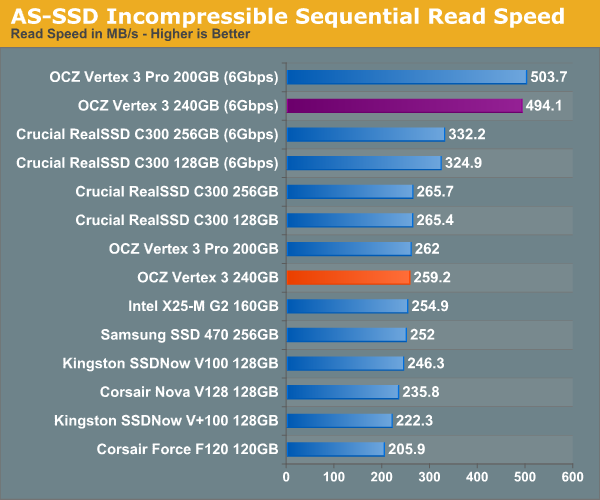
AS-SSD High Queue Depth Incompressible Sequential Performance
While ATTO shows us best case scenario for the SF-2500, AS-SSD shows us the worst case - at least for writes. The AS-SSD sequential benchmark takes place at a very high queue depth of 32 and uses incompressible data for all of its transfers. The result is a pretty big reduction in sequential write speed on SandForce based controllers.
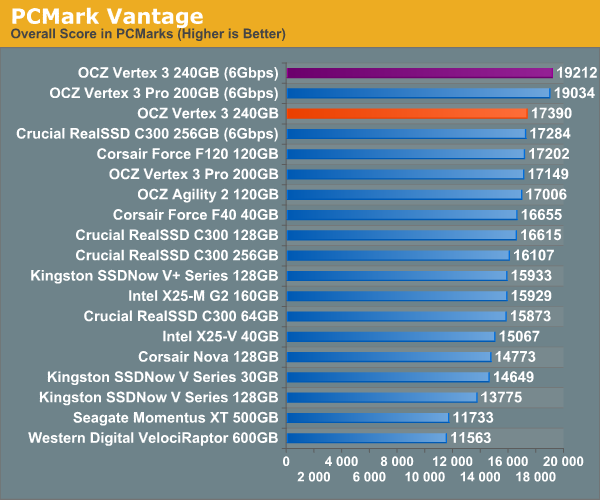
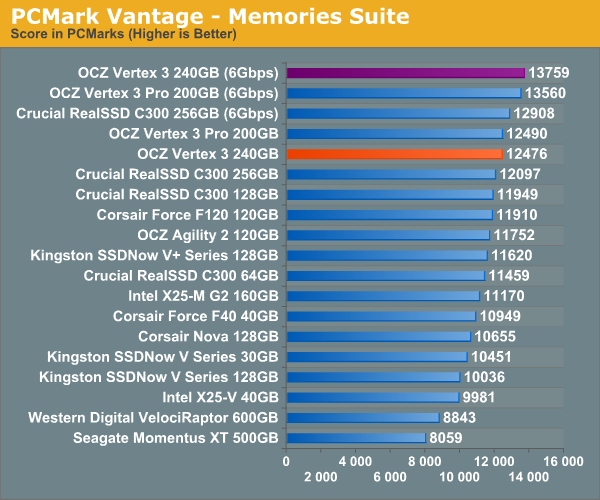
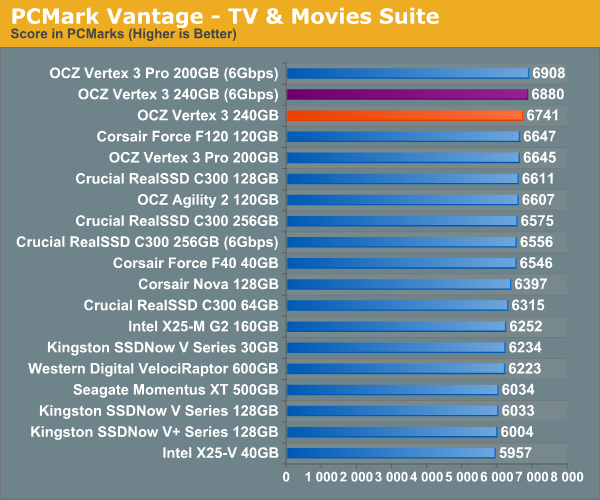
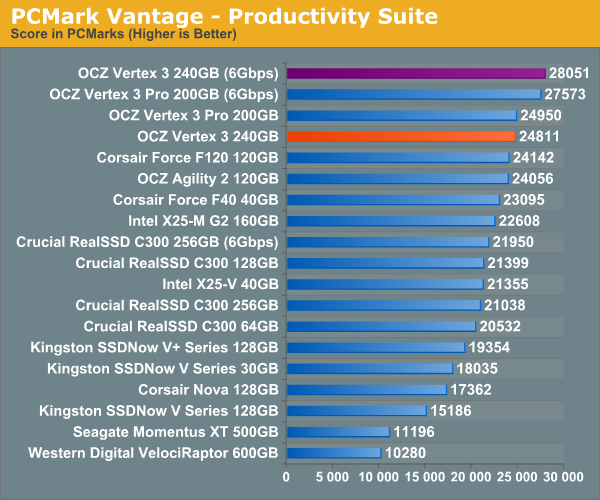
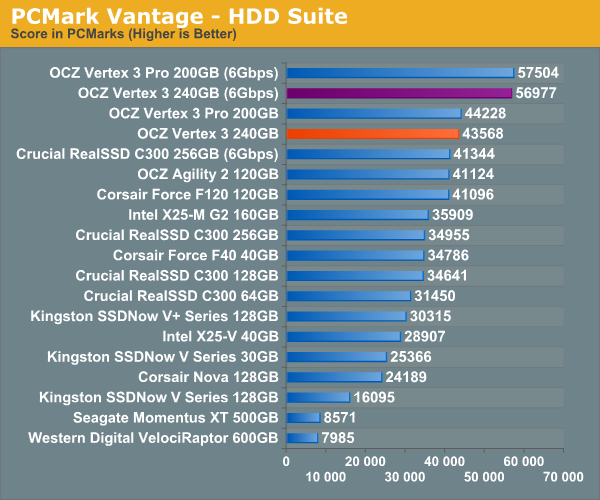
Overall System Performance using PCMark Vantage
Next up is PCMark Vantage, another system-wide performance suite. For those of you who aren’t familiar with PCMark Vantage, it ends up being the most real-world-like hard drive test I can come up with. It runs things like application launches, file searches, web browsing, contacts searching, video playback, photo editing and other completely mundane but real-world tasks. I’ve described the benchmark in great detail before but if you’d like to read up on what it does in particular, take a look at Futuremark’s whitepaper on the benchmark; it’s not perfect, but it’s good enough to be a member of a comprehensive storage benchmark suite. Any performance impacts here would most likely be reflected in the real world.

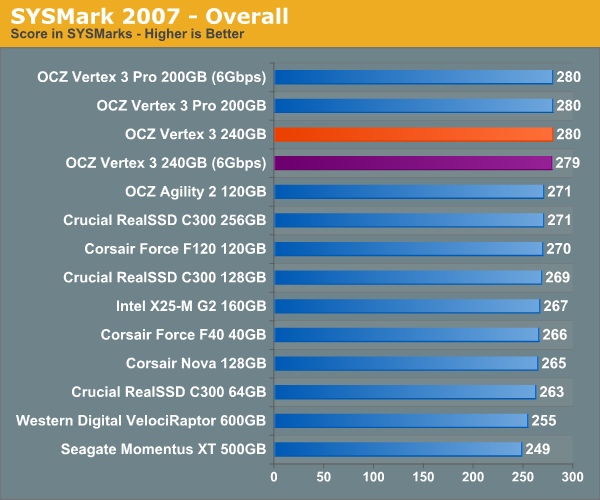
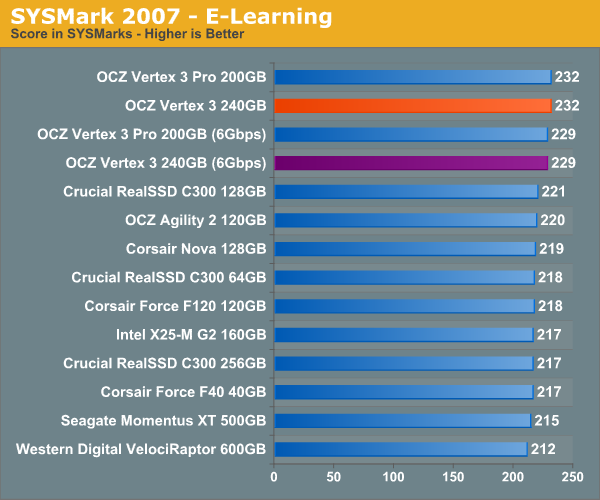
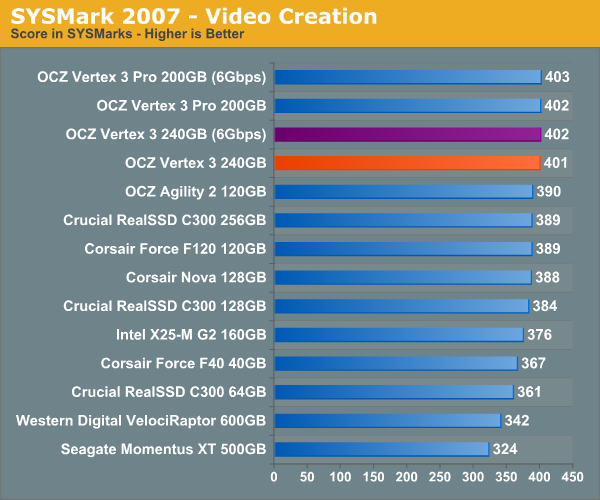
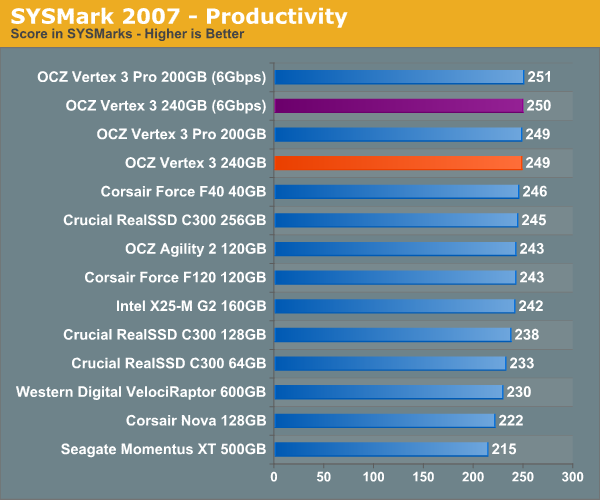
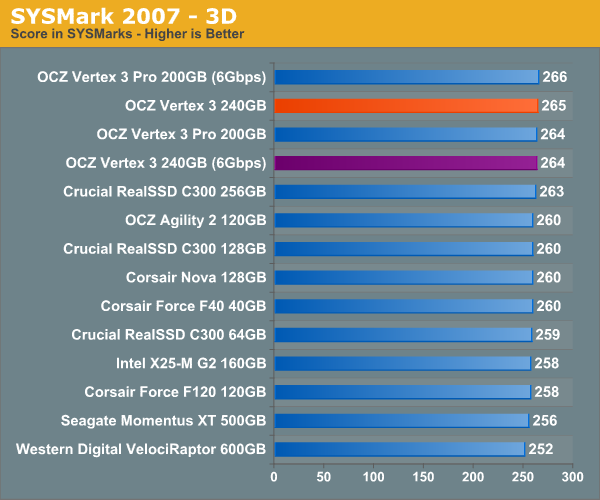
SYSMark 2007
SYSMark 2007 isn't nearly as demanding on the storage subsytem so we're mostly bottlenecked elsewhere.
AnandTech Storage Bench 2010
To keep things consistent we've also included our older Storage Bench. Note that the old storage test system doesn't have a SATA 6Gbps controller, so we only have one result for the 6Gbps drives.
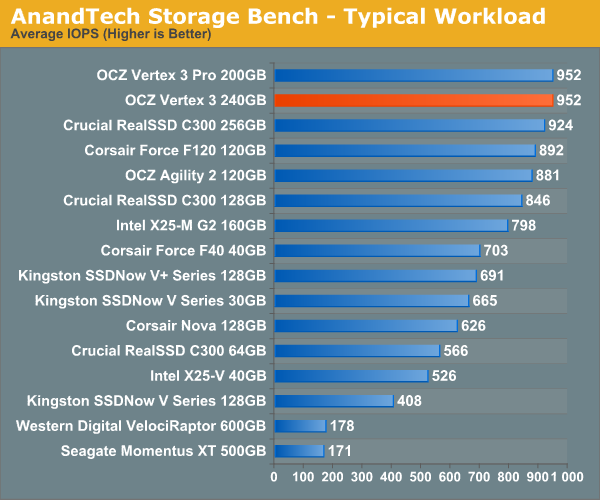
The first in our benchmark suite is a light/typical usage case. The Windows 7 system is loaded with Firefox, Office 2007 and Adobe Reader among other applications. With Firefox we browse web pages like Facebook, AnandTech, Digg and other sites. Outlook is also running and we use it to check emails, create and send a message with a PDF attachment. Adobe Reader is used to view some PDFs. Excel 2007 is used to create a spreadsheet, graphs and save the document. The same goes for Word 2007. We open and step through a presentation in PowerPoint 2007 received as an email attachment before saving it to the desktop. Finally we watch a bit of a Firefly episode in Windows Media Player 11.
There’s some level of multitasking going on here but it’s not unreasonable by any means. Generally the application tasks proceed linearly, with the exception of things like web browsing which may happen in between one of the other tasks.
The recording is played back on all of our drives here today. Remember that we’re isolating disk performance, all we’re doing is playing back every single disk access that happened in that ~5 minute period of usage. The light workload is composed of 37,501 reads and 20,268 writes. Over 30% of the IOs are 4KB, 11% are 16KB, 22% are 32KB and approximately 13% are 64KB in size. Less than 30% of the operations are absolutely sequential in nature. Average queue depth is 6.09 IOs.
The performance results are reported in average I/O Operations per Second (IOPS):
If there’s a light usage case there’s bound to be a heavy one. In this test we have Microsoft Security Essentials running in the background with real time virus scanning enabled. We also perform a quick scan in the middle of the test. Firefox, Outlook, Excel, Word and Powerpoint are all used the same as they were in the light test. We add Photoshop CS4 to the mix, opening a bunch of 12MP images, editing them, then saving them as highly compressed JPGs for web publishing. Windows 7’s picture viewer is used to view a bunch of pictures on the hard drive. We use 7-zip to create and extract .7z archives. Downloading is also prominently featured in our heavy test; we download large files from the Internet during portions of the benchmark, as well as use uTorrent to grab a couple of torrents. Some of the applications in use are installed during the benchmark, Windows updates are also installed. Towards the end of the test we launch World of Warcraft, play for a few minutes, then delete the folder. This test also takes into account all of the disk accesses that happen while the OS is booting.
The benchmark is 22 minutes long and it consists of 128,895 read operations and 72,411 write operations. Roughly 44% of all IOs were sequential. Approximately 30% of all accesses were 4KB in size, 12% were 16KB in size, 14% were 32KB and 20% were 64KB. Average queue depth was 3.59.
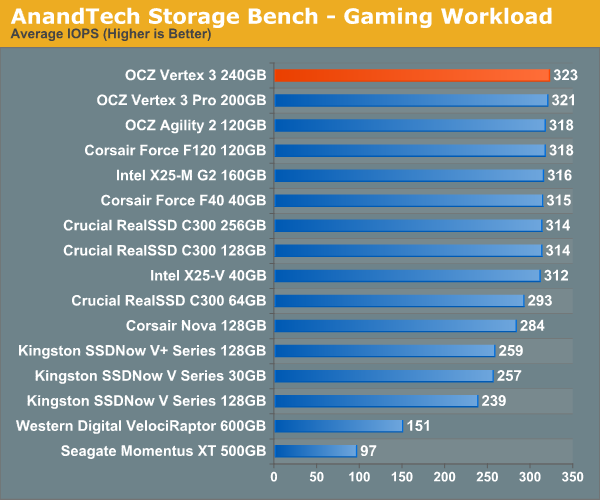
The gaming workload is made up of 75,206 read operations and only 4,592 write operations. Only 20% of the accesses are 4KB in size, nearly 40% are 64KB and 20% are 32KB. A whopping 69% of the IOs are sequential, meaning this is predominantly a sequential read benchmark. The average queue depth is 7.76 IOs.
Final Words
Just as we saw with the SF-1200 vs. SF-1500, there's absolutely no performance difference between the Vertex 3 Pro and the Vertex 3. In fact, the Vertex 3 does benchmark slightly faster in our tests thanks to the use of Micron 25nm NAND. If you were excited about the performance of the Vertex 3 Pro but were put off by the price, it looks like that'll be a non-issue thanks to the Vertex 3.
The performance of this second generation of SandForce based SSDs is nothing short of astounding. The big questions really are about reliability and firmware maturity, both of which we can't really answer until we get final drives in hand with mass production firmware.
At the same time there are a couple of new SSDs headed to market in the coming weeks that will compete in this space. Next up? Corsair and Intel.


